Skip to content
HiTrade Official – Trading, Price Action & Chart Analysis
  • Home
  • Crypto
  • Forex
  • Stocks
    • Bullish
    • Bearish
    • Side Ways
  • Chart Pattern

Blog

Your blog category

Double Top pattern in natural gas trading with resistance levels, breakout point, and price action analysis.

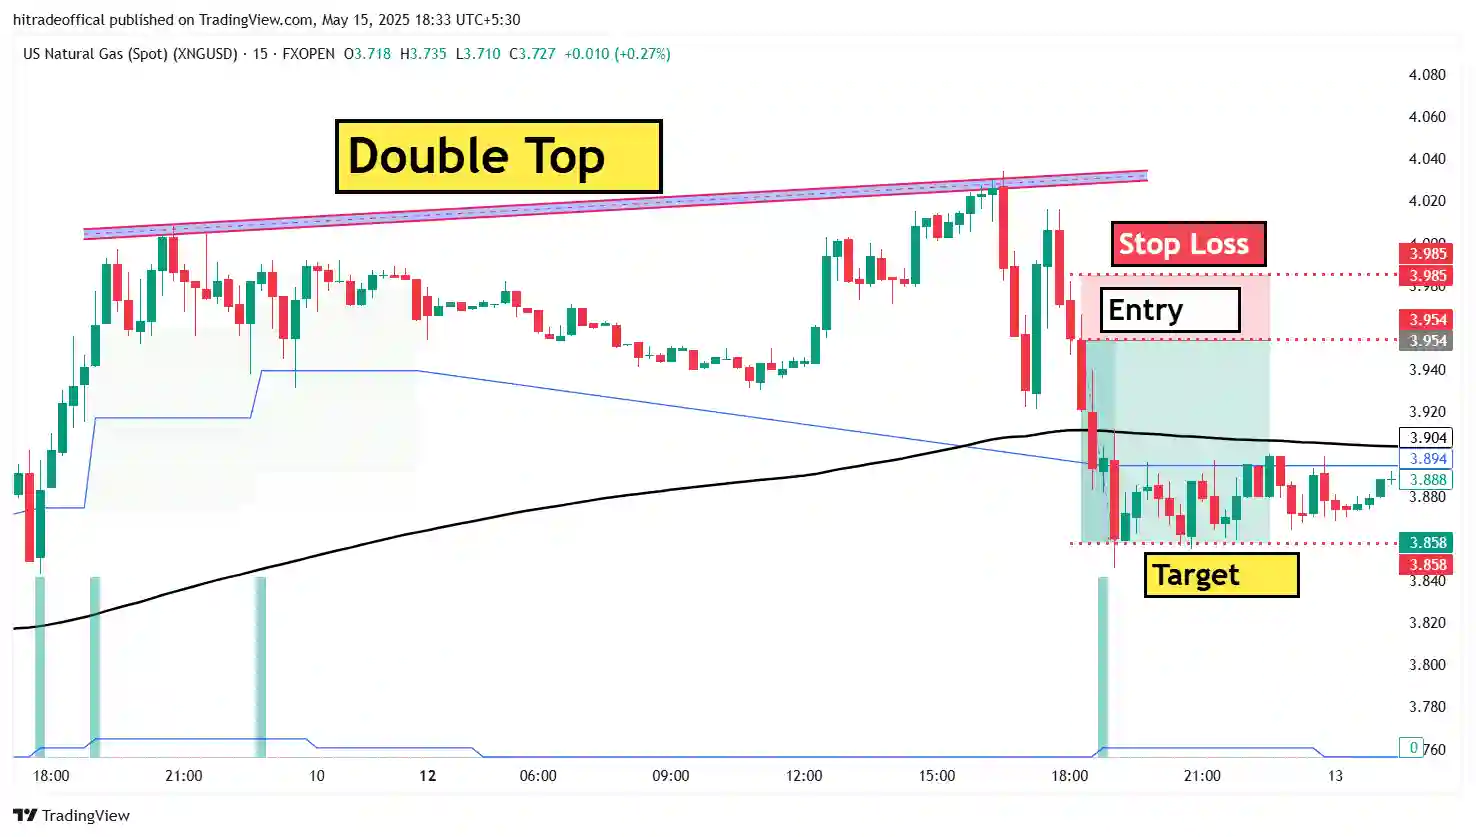
Mastering the Double Top Pattern: A Powerful Strategy for Natural Gas Trading

March 23, 2025

Introduction :- The Double Top pattern is a key bearish reversal formation that helps …

Read more

Crude oil trading chart showing support and resistance levels with key breakout and reversal zones.

How to Trade Crude Oil Using Support and Resistance Strategies

March 23, 2025

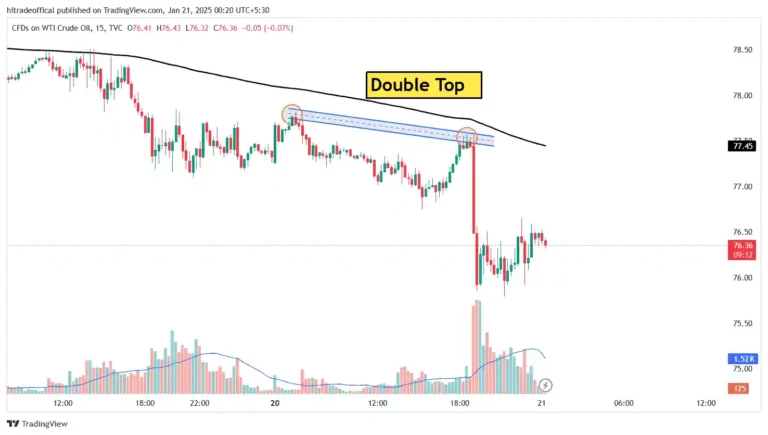
Introduction Crude oil trading is one of the most volatile and profitable markets, attracting …

Read more

USOIL price chart showing key support and resistance levels with consolidation patterns.

Crude Oil Price Analysis: How to Spot Breakouts & Reversals

March 21, 2025

Understanding USOIL Price Consolidation & Key Levels USOIL (WTI Crude Oil) experiences price consolidation …

Read more

Gold trading chart showing box consolidation, breakout, and resistance levels (R1, R2) with technical analysis indicators.

Gold Trading Strategy: Paper Trading & Back-testing Insights

March 16, 2025

Introduction Gold (XAU/USD) has always been a popular asset for traders due to its …

Read more

Double Top Pattern in WTI Crude Oil Trading – Bearish Reversal Signal with Key Resistance Levels.

Double Top Pattern in Crude Oil Trading: A Complete Guide for Traders

March 14, 2025

1. Understanding the Double Top Pattern in Crude Oil Trading A Double Top Pattern …

Read more

False breakout trading strategy example on WTI Crude Oil chart, highlighting entry, stop-loss, and target levels with key trading insights.

How to Trade False Breakouts Effectively: A Complete Guide for Traders

March 13, 2025

Introduction Trading breakouts is a common strategy used by traders to capitalize on market …

Read more

Bitcoin price chart showing key support and resistance levels with technical analysis on TradingView. BTC/USD trading between $81,000 support and $84,500 resistance.

Bitcoin Price Analysis: Key Support and Resistance Levels – Will BTC Breakout or Retrace?

March 13, 2025

Introduction Bitcoin (BTC) continues to show volatility in 2025 as traders analyze key support …

Read more

Gold (XAUUSD) 15-minute chart showing a Box Pattern breakout strategy with entry, stop-loss, and target levels.

Mastering Box Pattern Trading: A Profitable Strategy for Gold (XAUUSD) Traders

March 23, 2025March 13, 2025

Introduction Trading in the financial markets requires discipline, strategy, and technical analysis. One of …

Read more

Double Top Pattern on WTI Crude Oil Chart - Technical Analysis with Two Peaks and Neckline Resistance

Double Top Pattern in Trading: A Comprehensive Guide for Traders

March 12, 2025

Introduction The Double Top Pattern is one of the most reliable reversal patterns in …

Read more

US Oil Form Double Top Pattern

US Oil Form Double Top Pattern, For Intraday Knowledge

March 12, 2025

About this image :- What is Double Top Pattern :- The Double Top pattern …

Read more

Older posts
Newer posts
← Previous Page1 Page2 Page3 Next →

Hariom Singh

This is Hariom Singh, I am a student as well as trader in Indain stock market and forex market. In this website we always talk about trading related query
Twitter WhatsApp YouTube

Latest Post

BNB 15-minute candlestick chart showing resistance and support levels, zone trading area, short entry, and target hit after price breakdown.

BNBUSD 15-Minute Chart Zone Trading Strategy with Entry and Target – HiTradeOfficial

June 8, 2025
ETHUSD chart showing short trade setup with entry, stop loss, and target levels marked based on support and resistance on June , 2025.

Ethereum Best Trading Strategy For Traders and Making Profit – HiTradeOffcial

June 2, 2025
SOLANA 15-minute crypto trading chart showing support and resistance trading strategy with entry and target levels marked.

Solana Crypto Hit The Target Using This Pattern, Crypto Trading

May 26, 2025
GBP/USD false breakout trade setup with resistance rejection and price target marked on 15-minute chart

GBPUSD Forex Pair Give More Than 74 Pipes Profit Using This Pattern

May 17, 2025
Double top pattern in US Natural Gas (XNGUSD) 15-minute chart with entry, stop loss, and target levels marked.

Natural Gas Making Double Top And Hit Target More Than 90 pipes

May 15, 2025
GBP/USD chart showing cup and handle pattern with marked entry, stop loss, and target zones

What is Cup Handle Pattern in Trading, How to trade using cup handle chart pattern

May 13, 2025
Hi Trade

If you have any type of problem and doubt than you can contact me by social media and email Thank You

Categories

Forex Trading

Chart Pattern

Stock Market

Cryptocurrency

Quick Links

About Us

Contact Us

Disclaimer

Privacy policy

Contact Us

Email: hitradeoffical@gmail.com

© hitradeofficial || All rights reserved || Hariom Singh