Skip to content
HiTrade Official – Trading, Price Action & Chart Analysis
  • Home
  • Crypto
  • Forex
  • Stocks
    • Bullish
    • Bearish
    • Side Ways
  • Chart Pattern

Bearish

US Oil Form Double Top Pattern

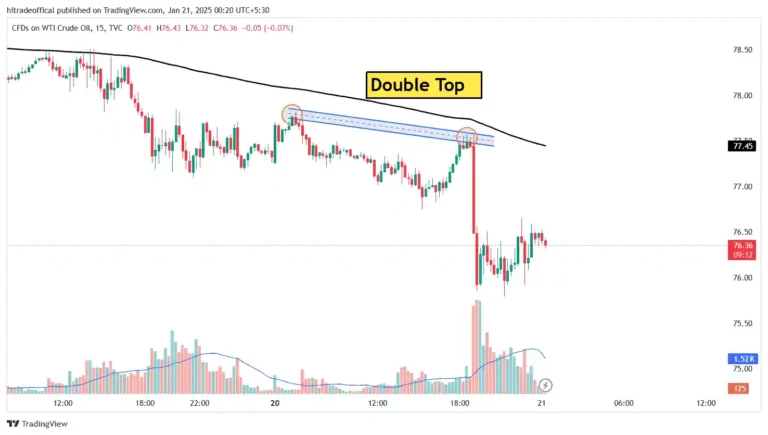
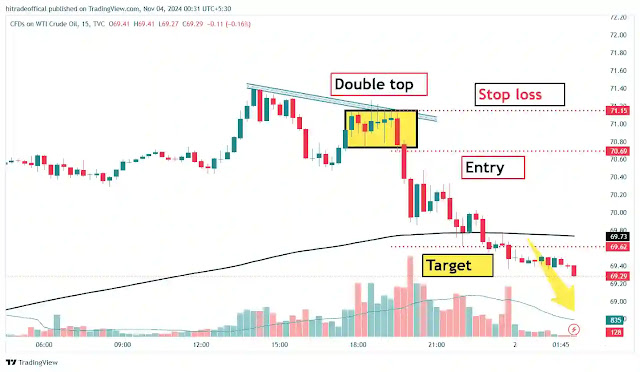
US Oil Form Double Top Pattern, For Intraday Knowledge

March 12, 2025

About this image :- What is Double Top Pattern :- The Double Top pattern …

Read more

US Oil formed double top pattern in 15min time frame

December 13, 2024December 5, 2024

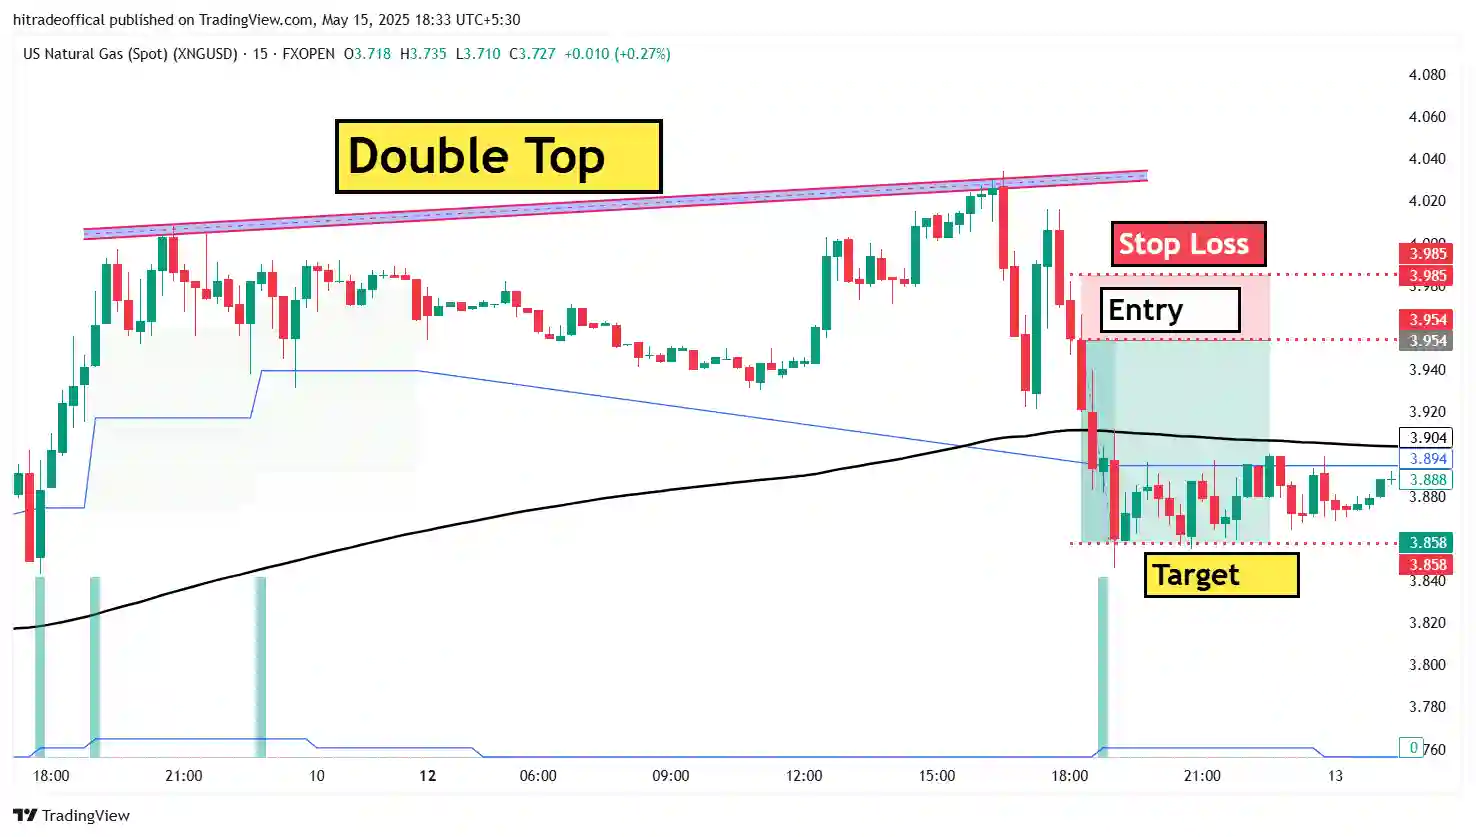
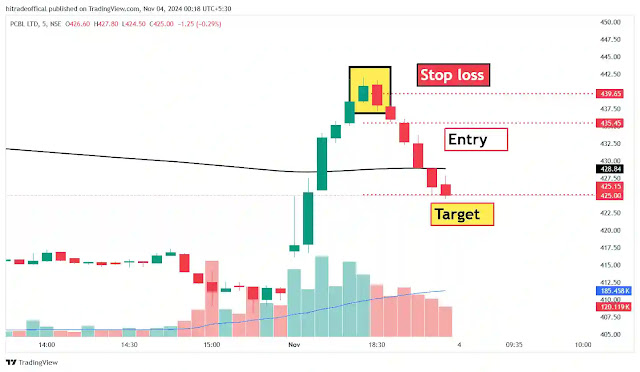
  About this image :- In this image you can see that double top …

Read more

Nifty 50 index made double top pattern for Intraday traders

December 14, 2024November 22, 2024

 About this image :- In this image you can see that a double top …

Read more

How to trade when bearish chart pattern form in live market

December 14, 2024November 13, 2024

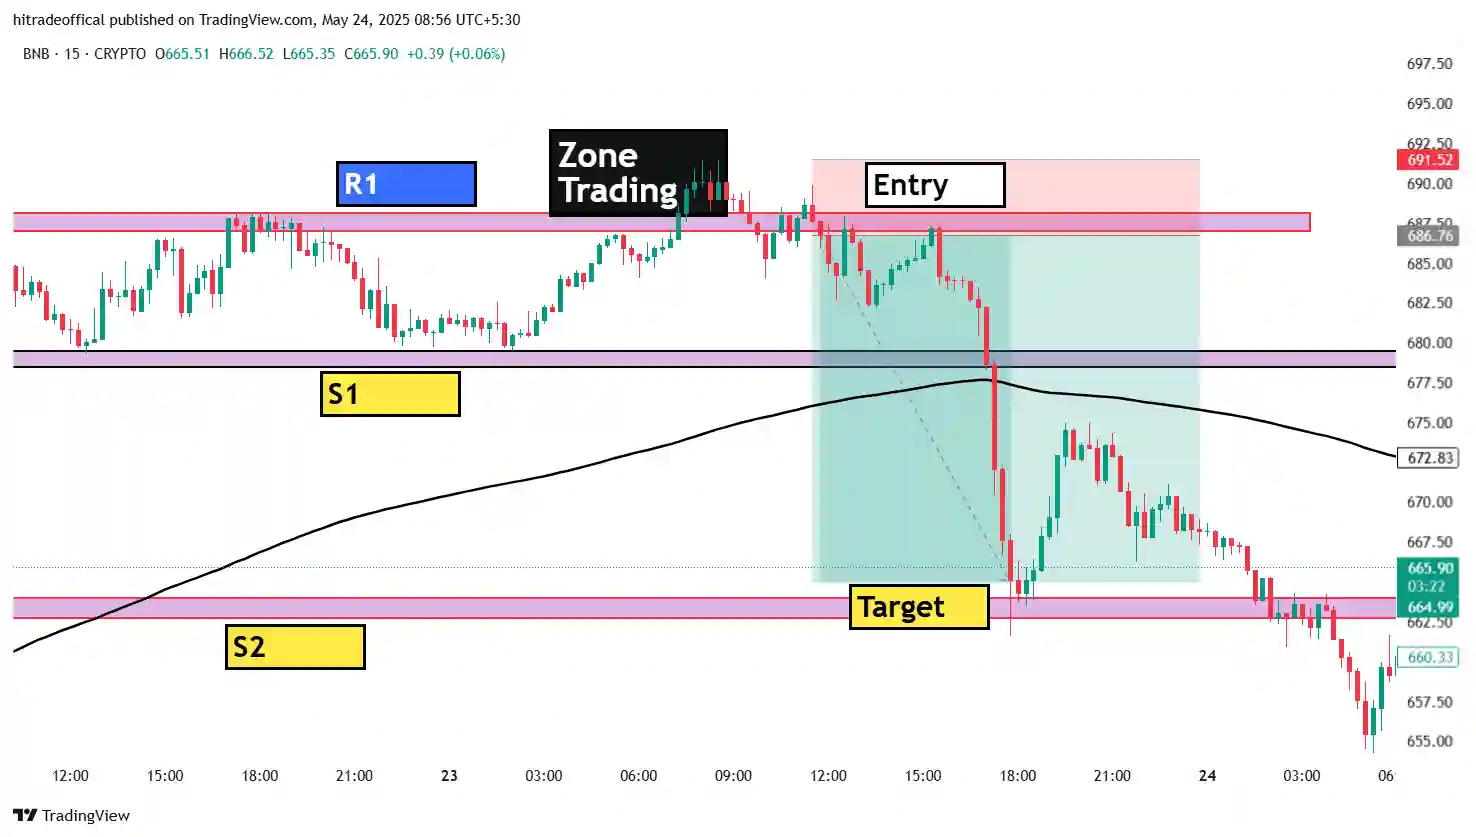
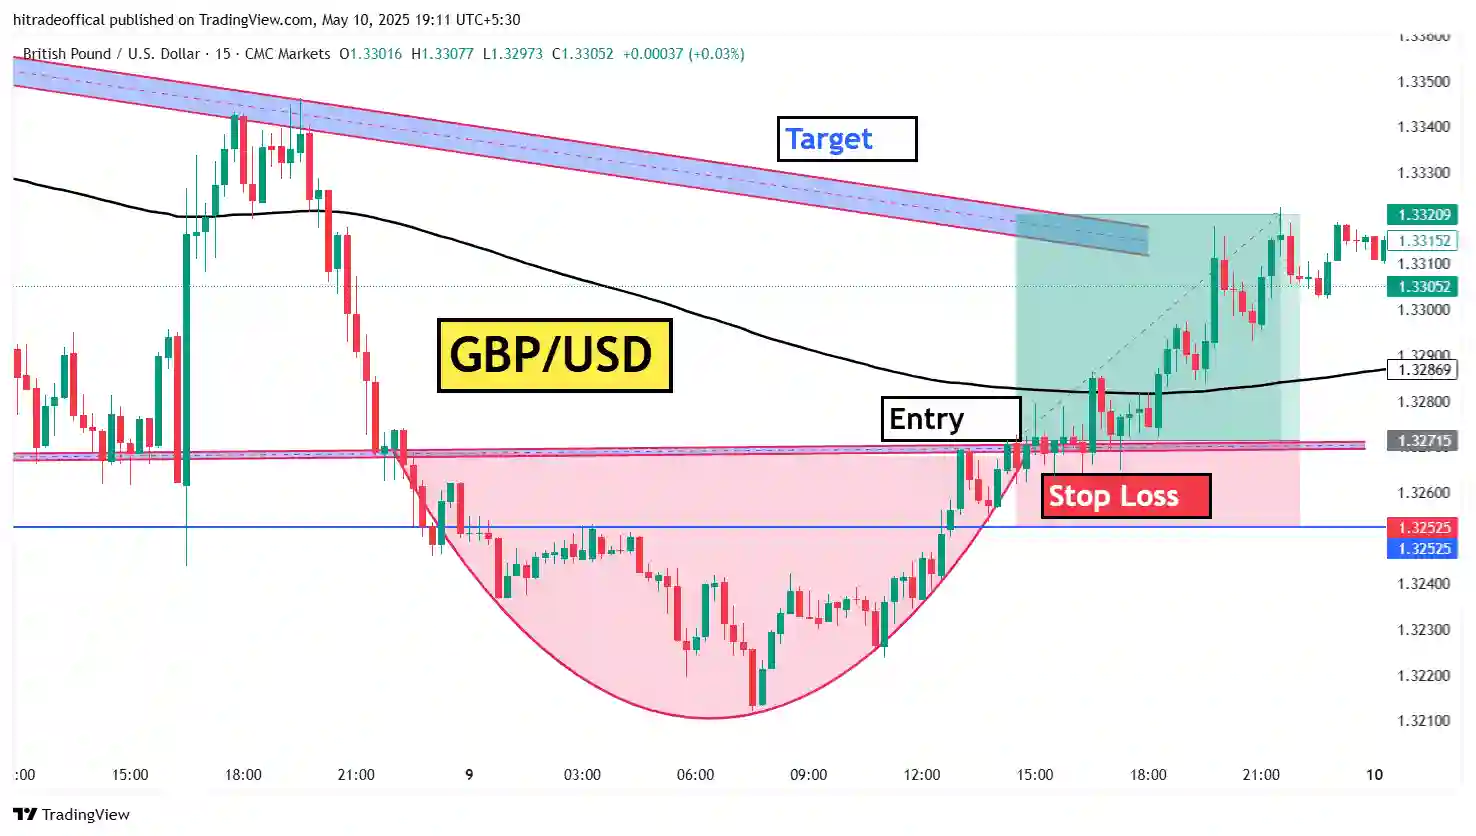
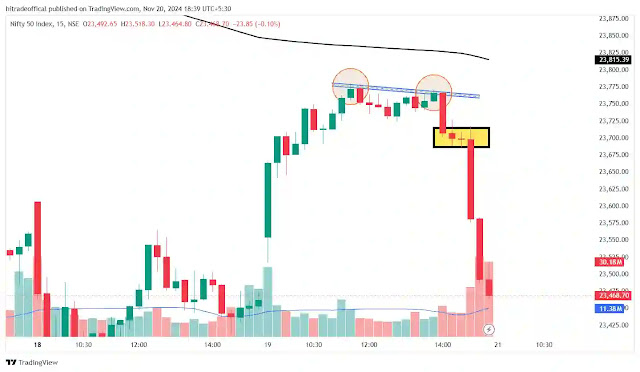
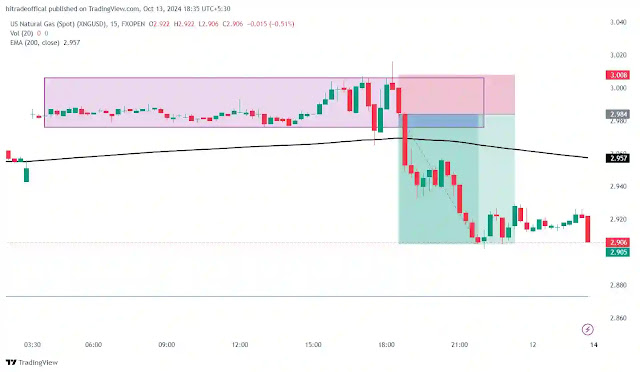
 About this image :- In this image you can see that a bearish chart …

Read more

This is the live result of trap trading, if you follow this than you can make money

December 14, 2024November 8, 2024

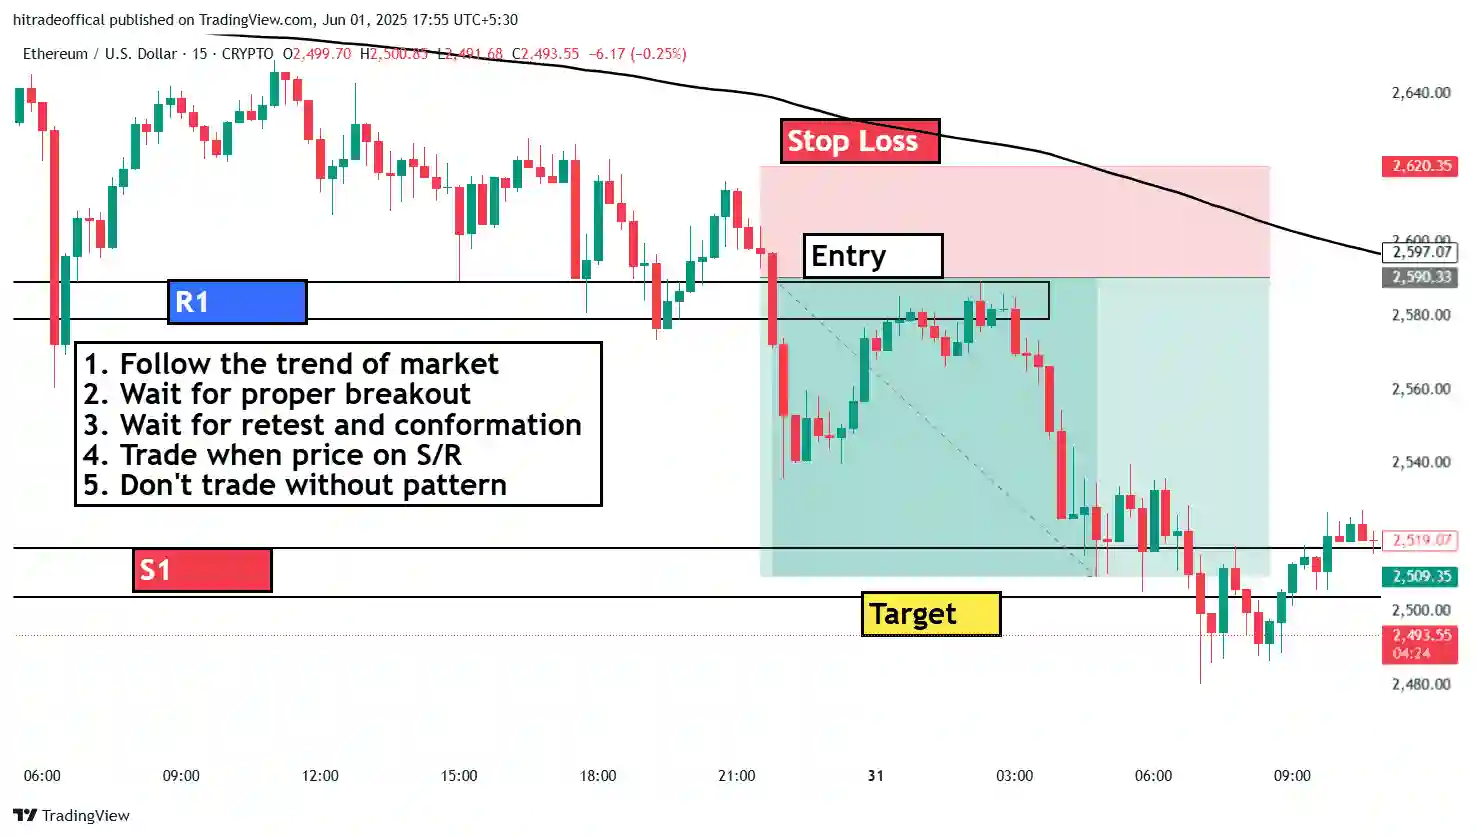
About this image :-  In this image you can see that a trap is …

Read more

How to plan our trade when form this pattern

December 16, 2024November 4, 2024

 About this image :-   In this image you can see that a double …

Read more

What is trap breakout and using trap trading how to make money

December 16, 2024November 2, 2024

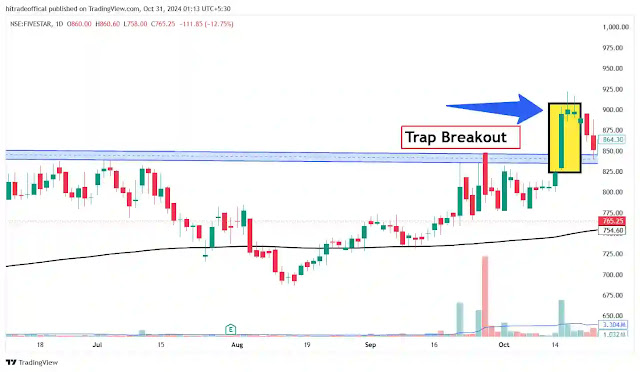
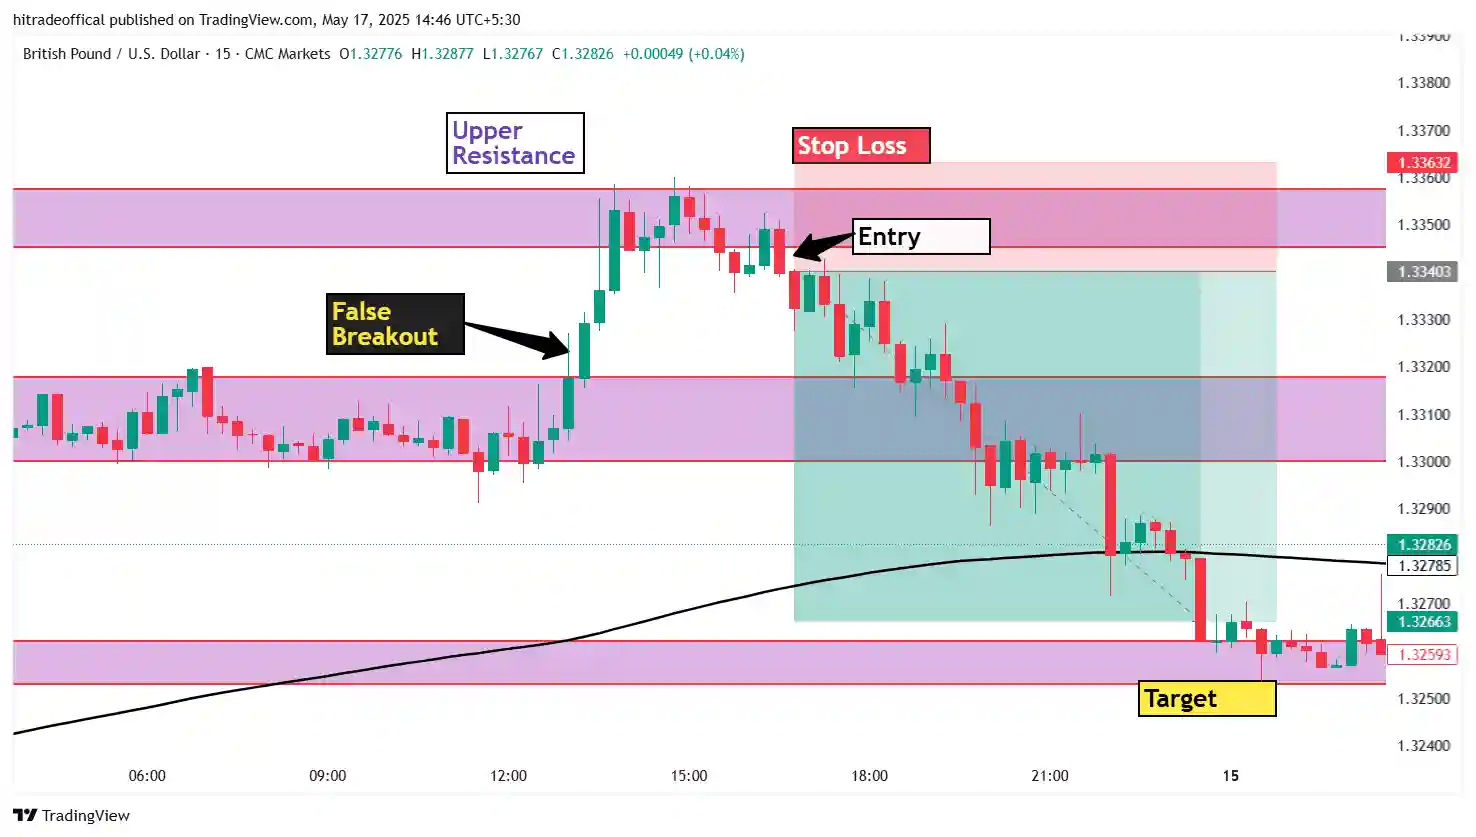
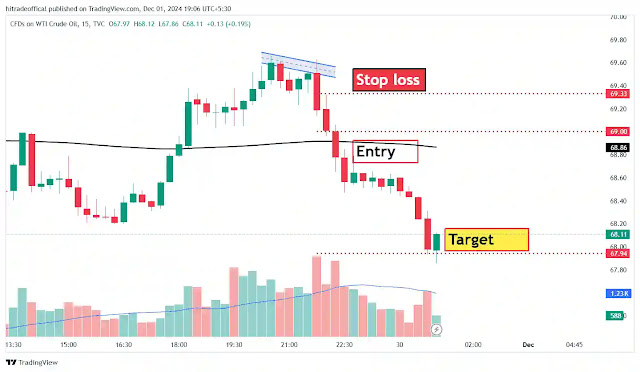
About this image :-   In this image you can see that a breakout …

Read more

What is double top pattern in trading by hitrade

December 16, 2024October 21, 2024

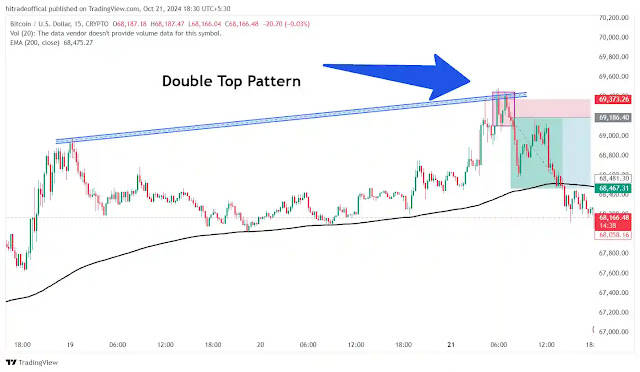
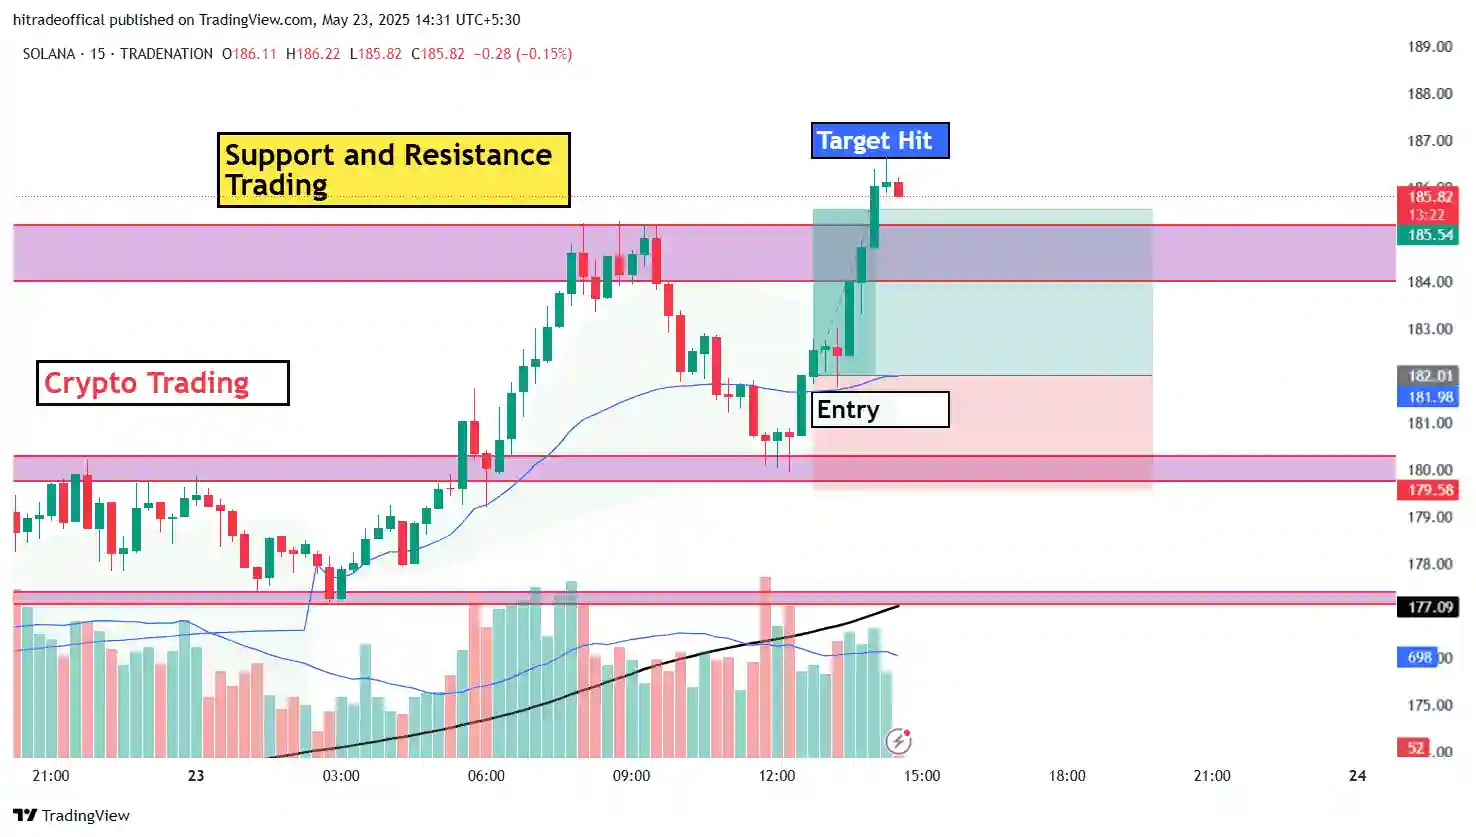
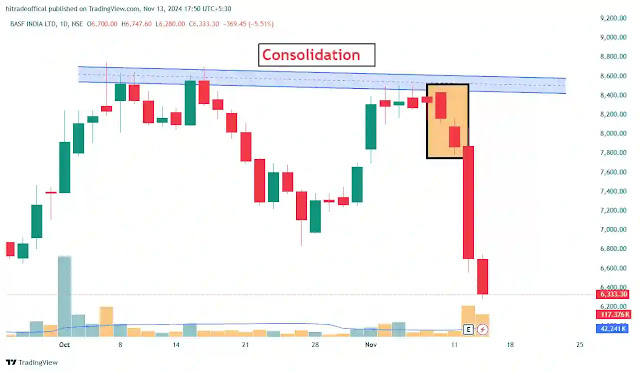
 About this image :- In this image you can see that the double top …

Read more

How to trade in live market using don’t trade in first breakout by hitradeofficial

December 16, 2024October 13, 2024

 About this image :-   In this image you can see that this is …

Read more

Nifty 50 chart

Why Nifty 50 are crashing now and Index also crashed? hitradeofficial

December 19, 2024October 4, 2024

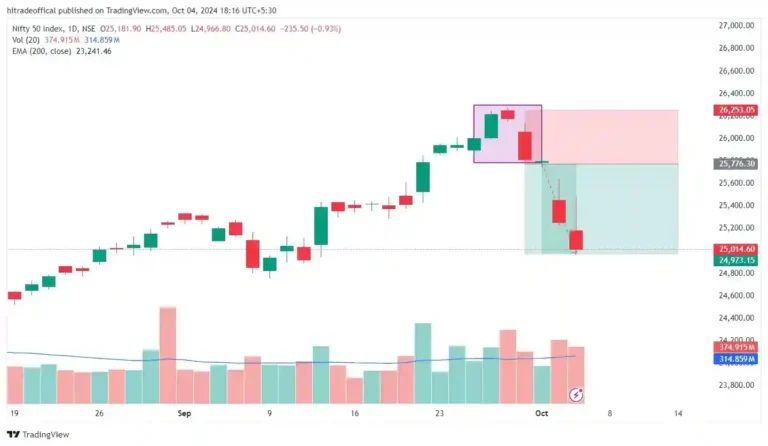
About this image :- In this image we can see that a chart of …

Read more

Older posts
Newer posts
← Previous Page1 Page2 Page3 Next →

Hariom Singh

This is Hariom Singh, I am a student as well as trader in Indain stock market and forex market. In this website we always talk about trading related query
Twitter WhatsApp YouTube

Latest Post

BNB 15-minute candlestick chart showing resistance and support levels, zone trading area, short entry, and target hit after price breakdown.

BNBUSD 15-Minute Chart Zone Trading Strategy with Entry and Target – HiTradeOfficial

June 8, 2025
ETHUSD chart showing short trade setup with entry, stop loss, and target levels marked based on support and resistance on June , 2025.

Ethereum Best Trading Strategy For Traders and Making Profit – HiTradeOffcial

June 2, 2025
SOLANA 15-minute crypto trading chart showing support and resistance trading strategy with entry and target levels marked.

Solana Crypto Hit The Target Using This Pattern, Crypto Trading

May 26, 2025
GBP/USD false breakout trade setup with resistance rejection and price target marked on 15-minute chart

GBPUSD Forex Pair Give More Than 74 Pipes Profit Using This Pattern

May 17, 2025
Double top pattern in US Natural Gas (XNGUSD) 15-minute chart with entry, stop loss, and target levels marked.

Natural Gas Making Double Top And Hit Target More Than 90 pipes

May 15, 2025
GBP/USD chart showing cup and handle pattern with marked entry, stop loss, and target zones

What is Cup Handle Pattern in Trading, How to trade using cup handle chart pattern

May 13, 2025
Hi Trade

If you have any type of problem and doubt than you can contact me by social media and email Thank You

Categories

Forex Trading

Chart Pattern

Stock Market

Cryptocurrency

Quick Links

About Us

Contact Us

Disclaimer

Privacy policy

Contact Us

Email: hitradeoffical@gmail.com

© hitradeofficial || All rights reserved || Hariom Singh