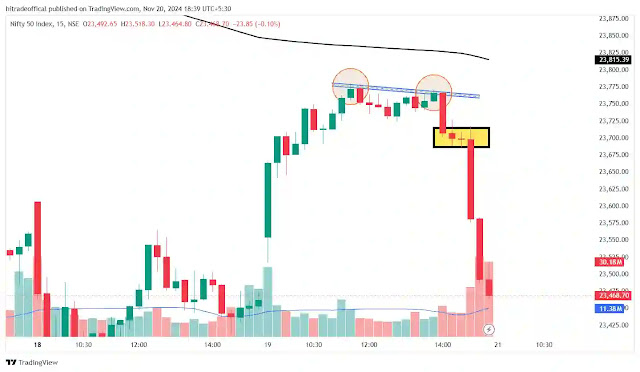
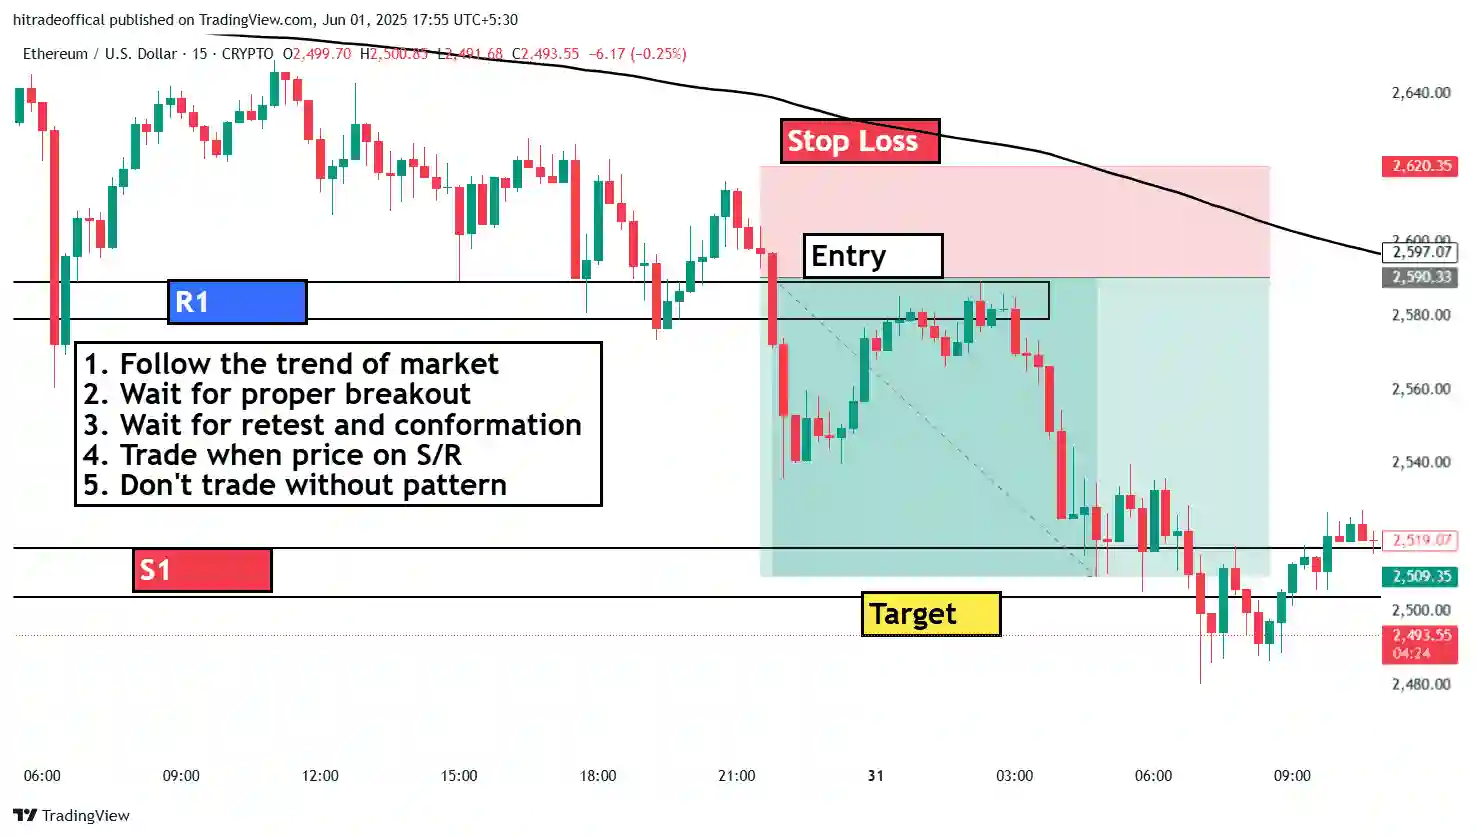
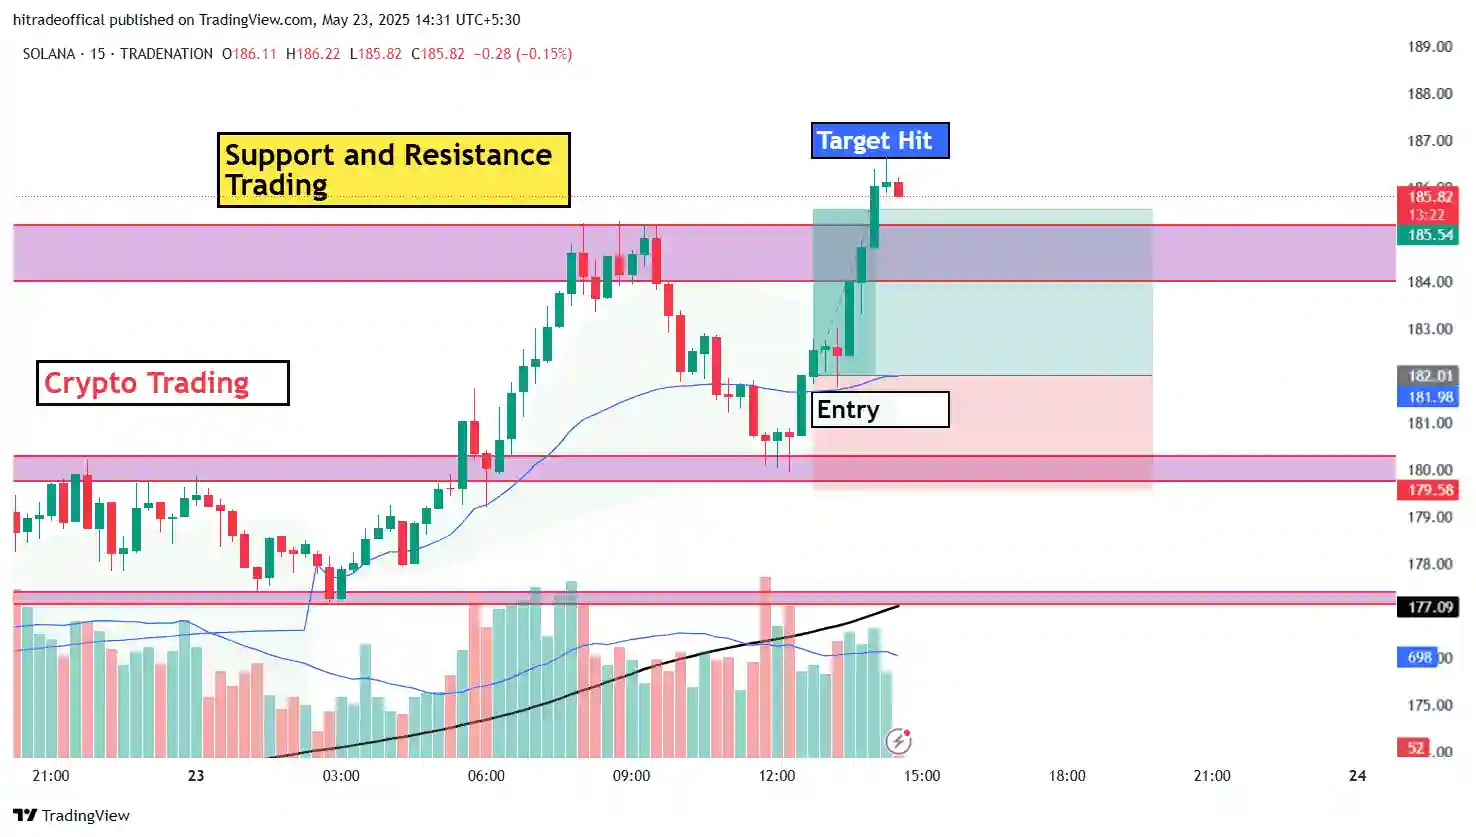
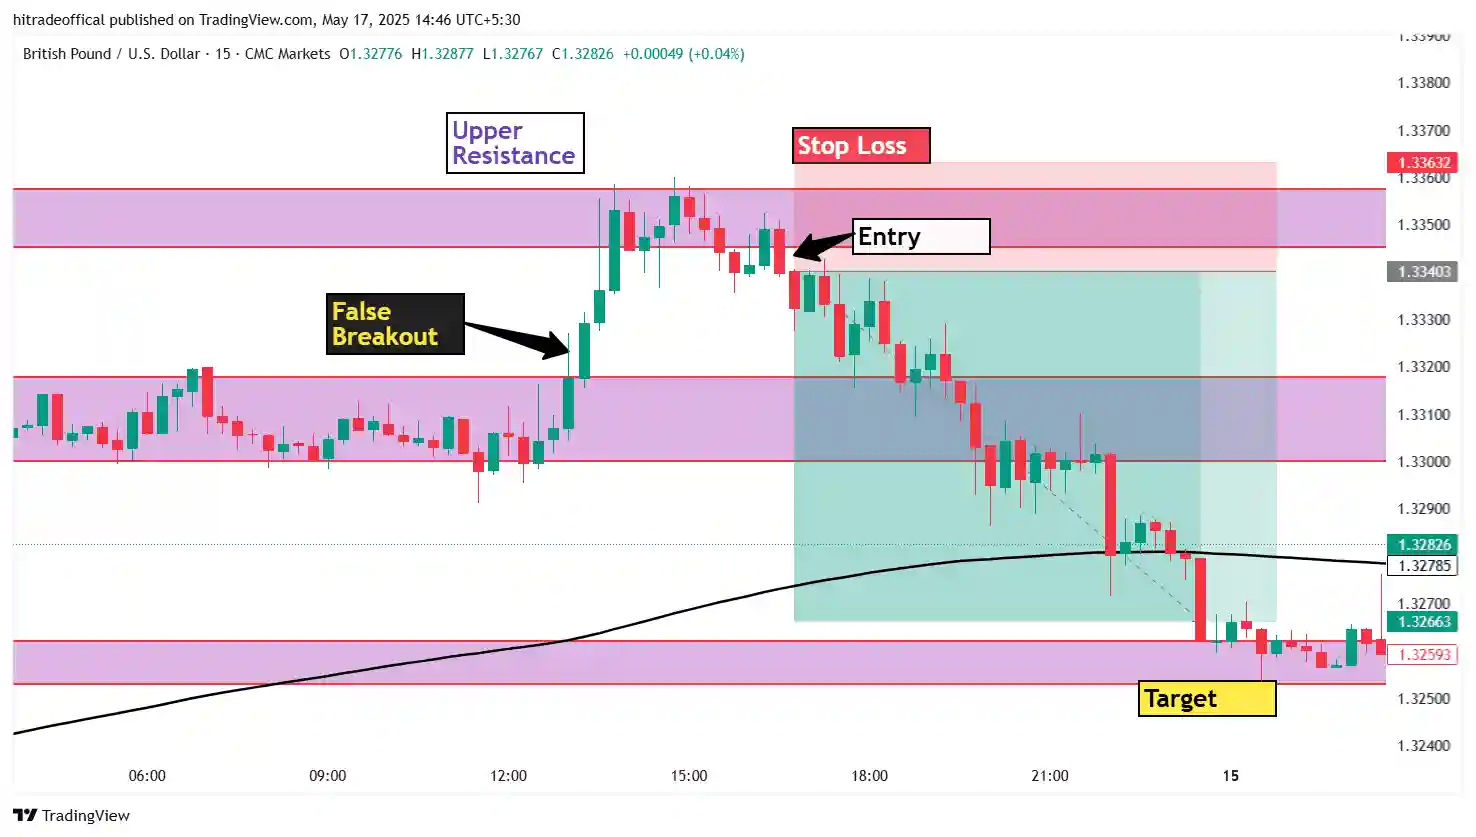
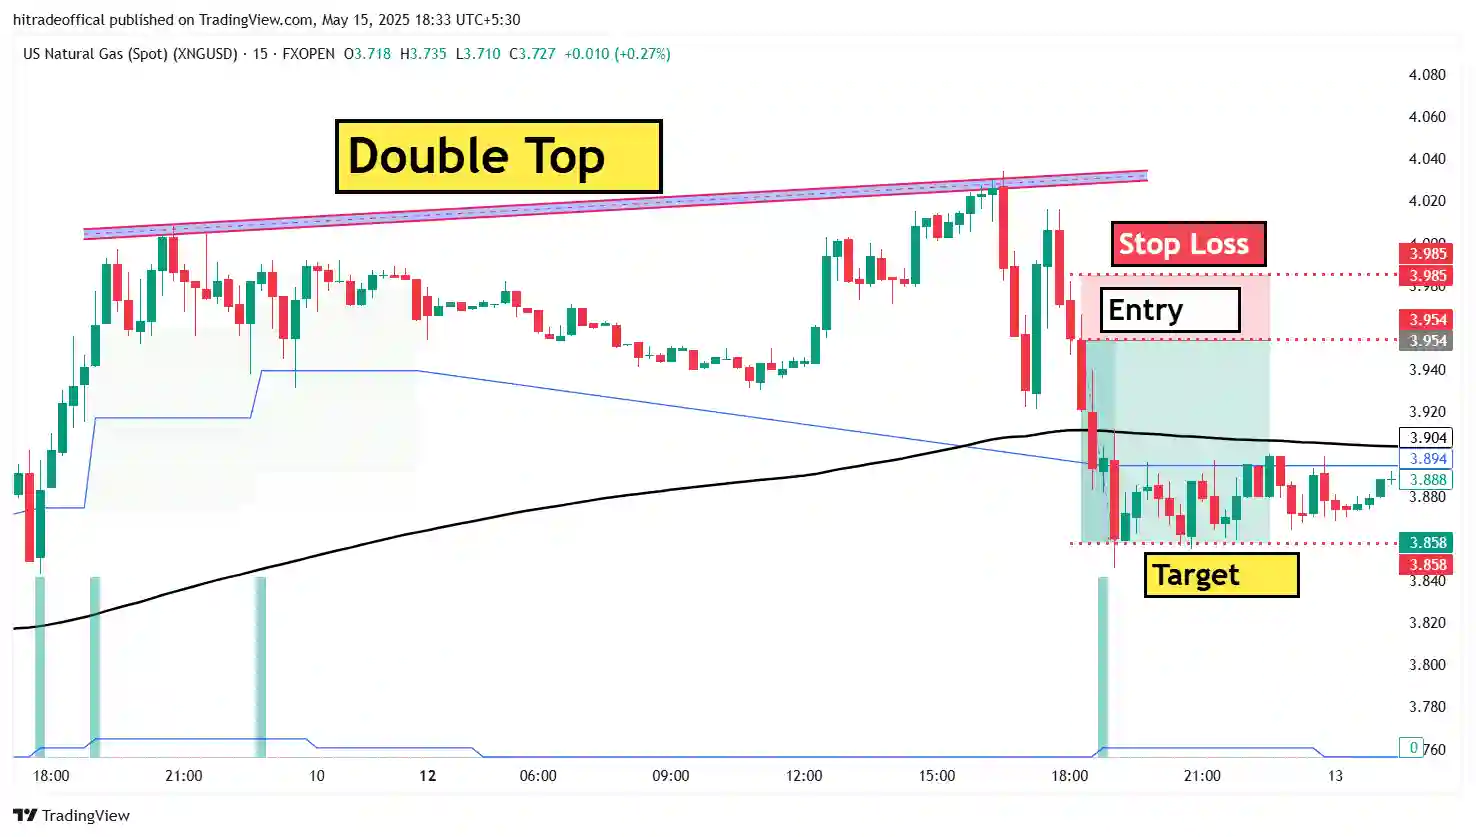
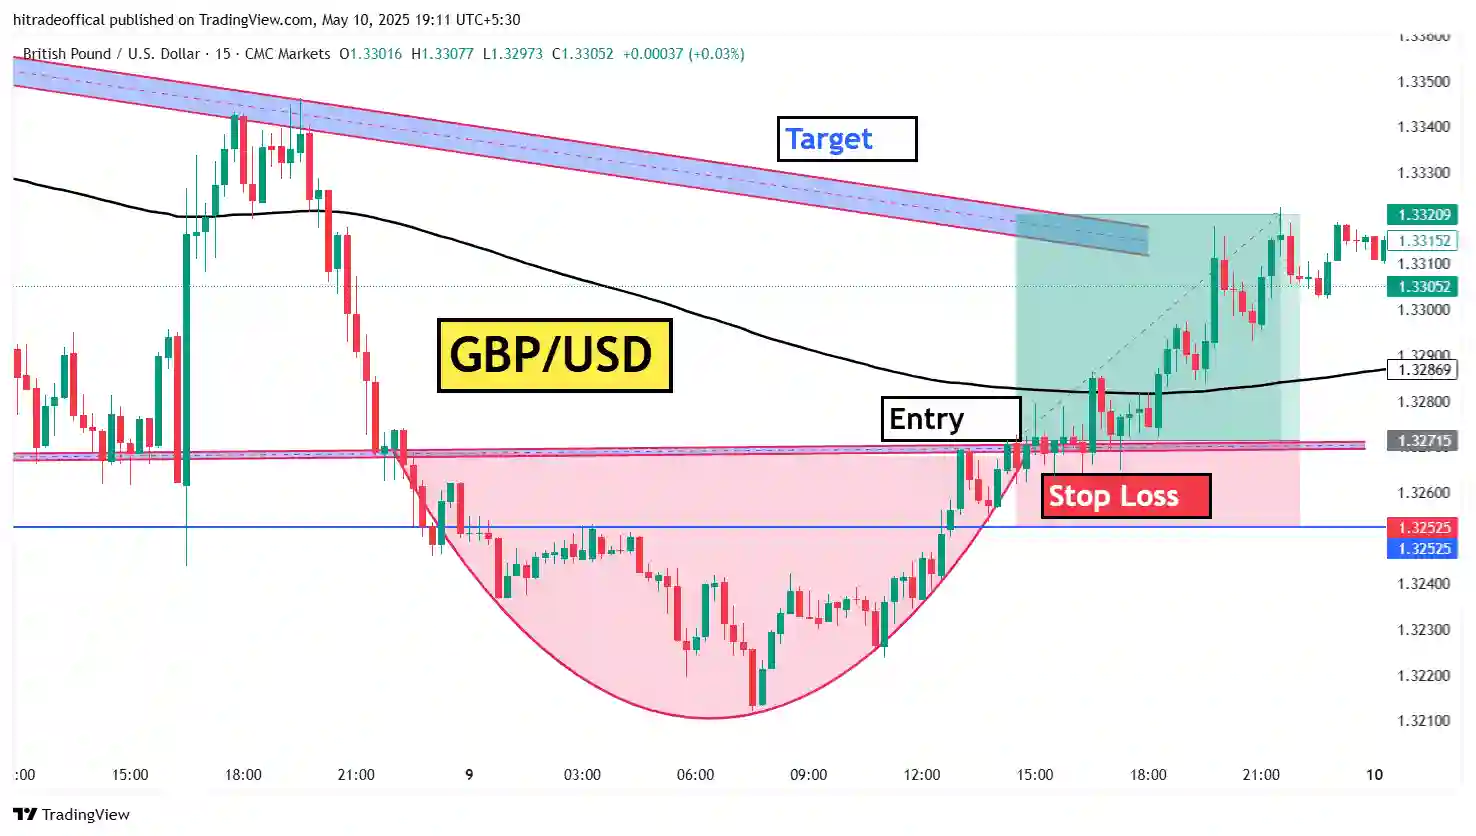
About this image :-
In this image you can see that a double top pattern is form and than start consolidation for some time and than price will starting towards falling.
So today in this post we learn about this pattern and how to work this pattern and how to find this pattern and what is our mindset when we are trading on this pattern.
Welcome to this post now keep learning and careful learning.
What is double top pattern :-
When price reach two times in top and with consolidation and than start falling price after form two top so this two top is known as double top pattern.
If you use double top pattern than may be you can book profit maximum time but if you want to book profit than also you need to learn how to plan our trade using double top pattern.
In this pattern if there are lots of profit so also in this pattern there are lots of losses like that if you don’t real use of this pattern than may be you have to need book loss.
How to find double top pattern :-
If you want to find double top pattern than you can follow these steps :-
The first step is open your top 500 stocks list from your index.
The second step is start scanning two top or double top chart pattern.
The third step is if any stock form double top pattern than you can mark those stocks.
The fourth step is you need to always see your marked stocks and wait for any movement.
The fifth step is if any movement is take place than you have to find price action.
According to chart structure and price action you can easily find double top pattern but you can also use our these steps, these steps is very helpful when you finding double top pattern.
This way you can easily find double top pattern when market is live or close and if you are new in trading field than you can do back test for your better result.
How to check real and fake pattern :-
If you want to check real and fake pattern than the first step is select those stock which is form any type of pattern and focus it.
When you select stock than the main work is see and watch careful and wait for any movement and if any not movement is take place than don’t use your more mind except waiting.
When any movement is take place than you remember always this golden point ” Don’t trade on the first breakout “. So don’t try to trade on the first breakout.
You need to wait for any price action or candle stick pattern you can also wait for second movement and you can check volume for identify trap.
If the first movement is take place in bullish side but price action or candle stick pattern is bearish side than you can say that this breakout is fake if also volume is not good.
This way you can check fake breakout as well as fake pattern so when you are able to find fake pattern or breakout than you can avoid your losses.
If the first movement is take place in bullish side and price action and candle stick pattern is also bullish and volume is also good than you can say that this pattern is real.
According to price action and candle stick pattern you can take position and also you can wait for second movement and try to measure stop loss before entry.
This way you can check real pattern or real breakout using this method you can easily find real pattern and you can take position according your risk and reward.
Is double top pattern is a bearish pattern :-
Yes, double top pattern is a bearish pattern. When double top pattern is form than you can plan your take in sell side.
Using double top pattern we can buy or not :-
No, you can’t buy using doble top pattern. Because double top pattern is a bearish pattern and when bearish pattern is form than market will start falling.
So, if you buy when start market is falling than you need to book loss. That’s why you can’t buy using double top pattern if you want to book profit.
This is a chart of same index but different time frame :-
About this image :-
In this image same index that name is nifty 50 but different time frame in this image we use 5min time frame and in this image you can see that same pattern is available but candle is more than as compare to before image.
Why we need to change our time frame :-
If you don’t want to skip your trade and you are a risk taker and you want to take trade on right time that time you need to change your time frame.
Because some time you are feeling that pattern is good and also you are watching that stock but you are using 15min time frame and before 15min candle closing.
Your stock price will be increase suddenly when shift your time frame towards higher to lower means 15min to 5min than you see in 5min time frame breakout is take place.
Due to 5min time frame breakout is take place and also price will suddenly increase before 15min candle closing so if you want to avoid this and you need to change your time frame.
You need to analysis your stock in multiple time frame and start analysis higher time frame to lower time frame like that 12months to 1D and than 30min, 15min and 5min and than plan your trade.
If you are doing intraday trading than try to take trade on 15min time frame and 5min time frame and also you can draw a line and start seeing multiple time frame.
These are some regions for we need to change our time frame. Also a good trade use multiple time frame before taking any trade.
What is the advantage of changing time frame :-
The main advantage of changing our time frame is making profit and avoid losing trade like that if any stock form bullish pattern in 15min time frame.
And same stock form bearish pattern in 5min and 1min time frame so when you see both movement in same stock than may be some time some trade will confuse.
But in that situation you can avoid your losing trade and you will prepare more before take any position and before entry you can easily avoid your loss and skip that trade.
So, there are lots of option before entry but after entry you have no more option except loss and profit so when you change your time frame than you are full prepare.
When you are finding for long time investment stock that time if change your time frame 1D towards 12months than may be your maximum double will close after seeing 12M time frame.
So, we always saying that a good trade use multiple time frame for analysis stock as well as without logic and pattern don’t trade this is the example of a good trade.
When we can plan our trade :-
If you want to plan your trade than first to first wait for a big movement and you can say that wait for first movement and after this first movement again wait for consolidation.
Because may be the first movement is trap if you are waiting for consolidation and during consolidation any price action or candle stick will form than match this candle stick or price action.
With your first movement if match is successful than see volume and your stop loss than you according to your risk your can plan your trade.
If match is not successful than you can wait for second movement or second breakout because when any stock form big movement or first movement and maximum stock again give second movement.
This way you can plan your trade but you have to remember always a point and the point is you have to avoid trap and avoid losses and losing stocks.
Why we need wait for consolidation :-
The main cause is avoid trap because in this time lots of trap is form and if you want to avoid trap than you have a best option which known as consolidation.
When you start waiting or consolidation during watching any stock than maximum trap you can avoid only using this consolidation method.
If you want to find your trade direction like that you want to trade in stock market but you don’t know I take trade in buy side or sell side.
That time if you wait for some time and wait for consolidation than you can find your trade direction during waiting consolidation.
Because when you are waiting or wait for consolidation after a big movement during consolidation there are lots of pattern form and on the basis of that pattern you can identify your trade direction.
If you want to trade in any stock than after big breakout at least wait for 4 candle because these 4 candle when form after than you can trade.
Because only 4 candle may be avoid your losses and also you learn this golden point and the golden point is ” If you are thinking after big movement your stock price will be increase suddenly than you are wrong”.
Because price increases step by step like step if any big movement is take place than price start consolidation otherwise price is starting retest.
So, following these region we need to wait for consolidation and always remember if you are waiting for consolidation and your trade will skip than don’t try to buy that stock.
What is trap in the trading :-
When price movement is bullish and technical and price action is bearish that time is called trap. This trap is form for both side like that bullish and bearish.
This trap is form some time good advantage and some time bad advantage but that is fully depend upon you if you are knowing use of trap than this is good for you.
If you don’t know how to use trap and using this trap how to make profit than this is bad for you so try to learn trap trading and using trap you can make more money as compare to other methods.
So, this is trap and if you want to make more money than you must learn trap trading and using trap trade you can really make more money as compare to other methods.
Why we need to wait for trap :-
If you want to skip your losses than you must need to wait for trap because in maximum case the first breakout is trap and when you are waiting for trap than you can avoid your losses.
When you are waiting for trap that time lots but price action form and during waiting time you can understand about your trade so we need to wait for trap if we want to book profit.
There are lots of positive region to wait for trap but we can’t explain here but you try to wait for formation of trap after formation of trap you can plan your trade.
In trading the main thing is your capital and you must focus on your capital that means if any trade is skip during waiting for trap than don’t worry at least your capital will safe.
Because if you have capital than you can find other trade but due to trap if you lose your capital than you have no more option so try to secure your capital.
These are the main region for we need to wait for trap because if you want to earn money using trading and stock market.
This is the chart of same index and same time frame :-
About this image :-
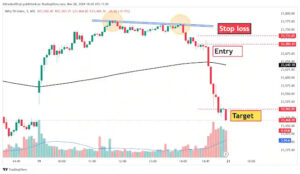
In this image same chart of same index and also same time frame that is 5min time frame we use but the different thing which is stop loss, entry and target point. So if you want to learn this thing you can read.
What is the right time of entry :-
The right time of entry is fully depend upon market and price action when your price action saying that time you can take trade and this is right time for your entry.
So, we can’t say that what is the right time of entry but till we can say that when your price action form and your strategy form that time you can entry in your trade.
Like that you can take example our last post image in this chart our right time of entry is after formation of consolidation and candle sticks.
After formation of trap when your price action is form and your price action with your movement of price action also match your strength of your volume than that is right time of your entry.
This way you can easily find what is the right time of entry as well as you can make profit more if you enter in right time than you can make more money as compare to other methods.
What is our entry point :-
In this chart our entry point if after consolidation and making red candle that is our entry point for this trade. But this is only back test so don’t try to use this level but you can use this method.
In number form our entry point is 23,700. You can used that level for your entry and you can see that result. This level give good result for sellers but again we are saying this is back test level.
This way you can plan your entry point but I requested to you don’t copy our number form level but you can learn this method and try to make level on the basis of itself.
What is our stop loss point :-
In this chart our stop loss point is 23,732. This is our stop loss level in number form but again we are saying that don’t use this level this is only for back test.
You try to measure your stop loss before your entry because at least you are knowing our stop loss is our range or not if our stop loss is not your range than you can avoid your trade that time.
You can use random method for finding your stop loss point and also you can use some technical method or some indicators.
This way you can find your stop loss point and you can avoid your losses and you can make profit and you can earn money using trading.
What is our target point :-
There are lots of method to finding target point like that you can find on the basis of technical and recent support or resistance.
You can use also random methods like you can thing when I get 10% profit out of my capital than I will book our profit. This is also a good method for booking target.
The last and most useful method is trailing stop loss in this time lots of traders using this method when your target will achieve than you can book some profit and start trailing your target.
This way you can find where you have to take your target and what is your target point and you can achieve more target as compare to other methods.
Learning of this post :-
There are lots of learning of this post like that we talk about some points.
The first point is what is double top pattern.
The second point is how to find double top pattern.
The third point is how to check real and fake breakout.
The fourth point is why we need for wait consolidation.
The fifth point is what is trap in trading.
There are some learning of this post. If you want to learn these whole post than you can use these titles and you can learn.
