Introduction: Mastering the Bearish Flag Pattern
The bearish flag pattern is a powerful continuation pattern that signals the resumption of a downtrend after a brief consolidation. It consists of a sharp price drop (flagpole) followed by a small upward or sideways channel (flag) before breaking down further.
This pattern is widely used in forex, commodities, and stock trading to identify high-probability short-selling opportunities. In this guide, we answer the top 10 questions about the bearish flag, helping traders identify, confirm, and trade it effectively.
1. Understanding the Bearish Flag Pattern in Trading
What is the Bearish Flag Pattern?
The Bearish Flag Pattern is a continuation pattern that signals the continuation of a downtrend after a temporary period of consolidation. It appears when an asset experiences a sharp price decline (flagpole), followed by a short consolidation period where the price moves slightly upward or sideways (flag), before resuming its downward movement.
This pattern is commonly used in technical analysis for forex, commodities, and stock trading, helping traders identify opportunities to enter short positions with minimal risk and high reward potential.
Key Features of the Bearish Flag Pattern:
- Flagpole: A strong and rapid price drop, usually driven by high selling pressure.
- Flag: A small consolidation phase where the price moves within parallel or slightly sloped trendlines.
- Breakout: The price breaks below the lower trendline of the flag, confirming the pattern and signaling further downside movement.
- Volume Confirmation: Volume typically declines during consolidation and spikes when the breakout occurs, validating the pattern.
When trading the bearish flag, traders look for an entry point near the breakout level, set a stop loss above the flag’s resistance, and target a price drop equal to the flagpole’s height.
Why is the Bearish Flag Pattern Important for Traders?
The bearish flag is a high-probability setup that allows traders to capitalize on strong trends. Here’s why it’s useful:
✅ Predictable Market Behavior: The pattern follows a structured formation, making it easier to anticipate price movements.
✅ Low Risk, High Reward: A well-placed entry and stop loss can lead to an excellent risk-to-reward ratio.
✅ Works Across Markets: The pattern appears in forex (XAU/USD, EUR/USD, GBP/USD), stocks (Tesla, Apple), and commodities (gold, crude oil).
How the Bearish Flag Works in Gold (XAU/USD) Trading
In gold trading, the bearish flag can indicate strong bearish momentum, often triggered by fundamental factors like:
📉 Rising US Dollar Strength – Gold tends to drop when the USD strengthens.
📉 High Interest Rates – As central banks raise interest rates, gold prices often decline.
📉 Geopolitical Stability – Reduced uncertainty in global markets can lead to lower demand for gold.
If you are a trader looking to refine your skills in technical analysis, check out more insights at HiTrade Official for in-depth articles and strategy breakdowns.
Other Helpful Resources:
🔹 Learn more about chart patterns from Investopedia.
🔹 Improve your forex trading skills at BabyPips.
🔹 Stay updated with gold market trends on TradingView.
2. Why the Bearish Flag is a High-Probability Setup
The Bearish Flag Pattern is one of the most reliable continuation patterns in technical analysis because it consistently follows a predictable structure. It occurs in a strong downtrend, making it a high-probability setup for traders looking to capitalize on further price declines.
Key Reasons Why the Bearish Flag Pattern Works So Well
✅ 1. Trend Continuation Confirmation
The bearish flag is a continuation pattern, meaning it forms in a strong downtrend and signals that the trend is likely to continue. Unlike reversal patterns, which involve greater uncertainty, the bearish flag follows a structured price action model:
- A steep price drop (flagpole)
- A temporary consolidation (flag)
- A breakout below the flag, leading to further declines
Since markets tend to move in trends, trading with the dominant trend significantly increases the probability of success.
✅ 2. Strong Institutional Selling Pressure
One of the reasons the bearish flag pattern is reliable is that it often forms due to institutional traders and hedge funds selling aggressively. When large financial players unload positions, it creates the strong downward momentum seen in the flagpole.
During the consolidation phase, retail traders might try to push the price slightly higher, but once institutional selling resumes, the price quickly breaks down, following the initial trend.
✅ 3. Clear Entry, Stop Loss, and Target Levels
Unlike some complex chart patterns, the bearish flag provides a well-defined entry point, stop loss, and take-profit target, making risk management easier.
- Entry: After price breaks below the lower trendline of the flag
- Stop Loss: Above the upper boundary of the flag
- Target: Equal to the height of the flagpole, measured from the breakout level
This structured risk-reward setup helps traders avoid emotional decisions and execute trades with a high level of confidence.
✅ 4. Works Across Multiple Timeframes
The bearish flag pattern appears on all timeframes, making it suitable for different types of traders:
- Scalpers & Day Traders use it on 5-minute and 15-minute charts for quick trades.
- Swing Traders look for it on 1-hour and 4-hour charts to capture larger moves.
- Position Traders & Investors can even spot it on daily and weekly charts for long-term market trends.
This flexibility allows traders to apply the pattern in different markets, including forex (EUR/USD, GBP/USD), commodities (gold, crude oil), and stocks (Tesla, Apple, Amazon).
✅ 5. Volume Confirms the Pattern
A major technical confirmation for the bearish flag is volume analysis:
- During the flagpole phase, volume surges as strong selling pressure drives prices lower.
- During the flag consolidation, volume declines, showing a lack of buying interest.
- At the breakdown, volume spikes again, confirming the return of sellers.
This volume behavior helps traders confirm the validity of the pattern and avoid false breakouts.
Real-World Example: Bearish Flag in Gold (XAU/USD)
A great example of the bearish flag pattern can be seen in gold trading (XAU/USD). When gold prices drop sharply due to rising U.S. dollar strength or interest rate hikes, traders often see bearish flags forming before further declines.
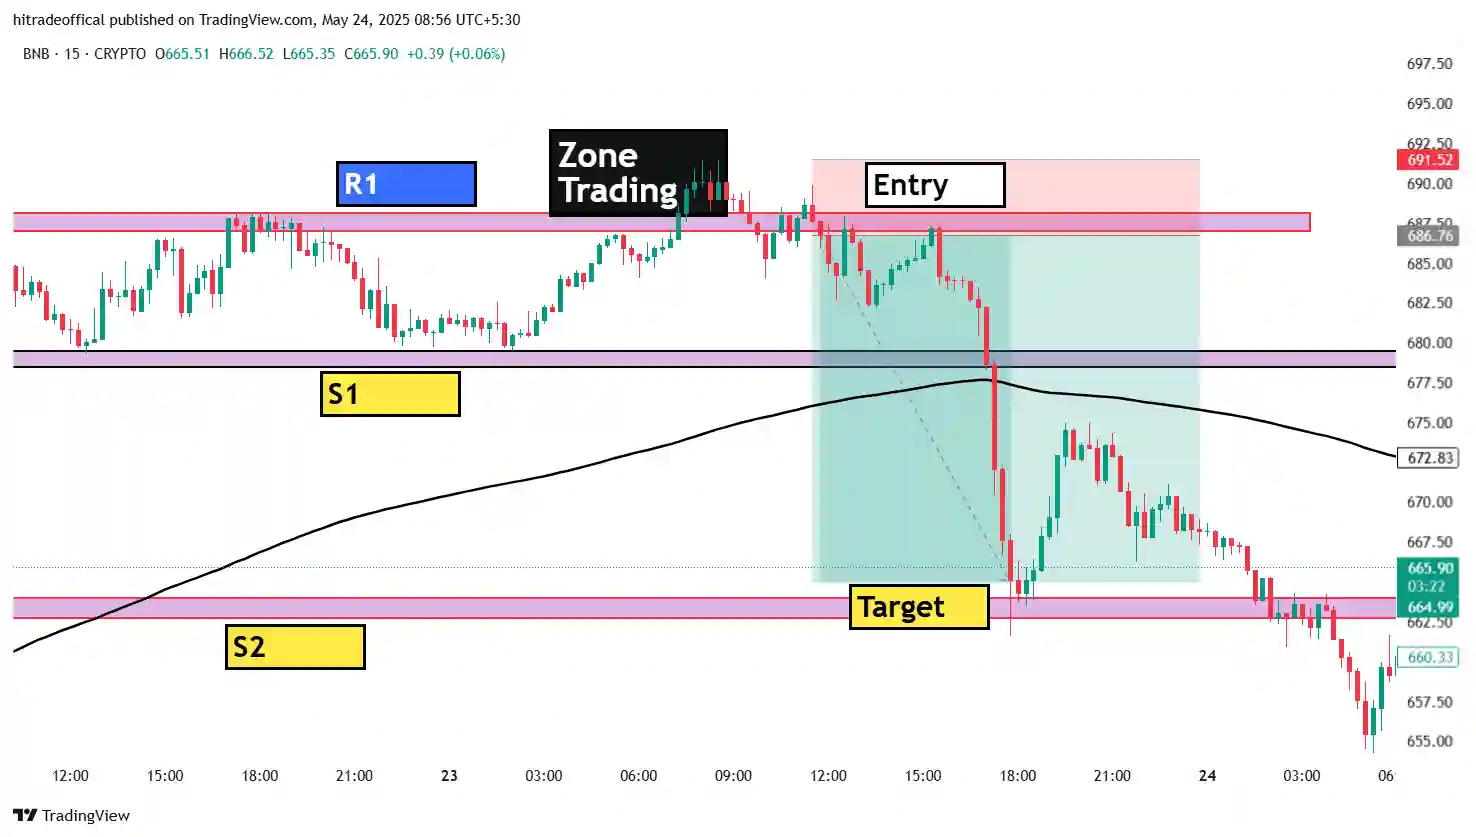
For example, in the chart above, we can see:
- A sharp decline in gold price (flagpole)
- A small upward consolidation before the breakdown (flag)
- A breakout that led to another strong downward move
Traders who identified this pattern early could have entered a short position with a well-defined stop loss and target, leading to high-probability profits.
If you want to explore more trading strategies and technical analysis patterns, visit HiTrade Official for expert insights.
Additional Resources for Learning:
📚 Investopedia – Learn more about chart patterns
📚 BabyPips – Forex trading strategies
📚 TradingView – Gold (XAU/USD) chart analysis
3. How to Identify a Bearish Flag on the Gold (XAU/USD) Chart
The Bearish Flag Pattern is one of the most reliable continuation patterns in technical analysis, especially in gold trading (XAU/USD). Identifying this pattern correctly can help traders make profitable short trades by entering at the right moment.
To recognize a bearish flag on the gold chart, follow these key characteristics:
✅ 1. Strong Downward Move (Flagpole Formation)
- The pattern starts with a sharp decline in price, forming the flagpole.
- This move is often driven by high selling pressure due to fundamental factors like:
- Strengthening of the U.S. dollar (DXY)
- Rising interest rates by the Federal Reserve
- Declining gold demand during stable economic periods
- In the chart above, the flagpole is seen as a strong bearish move before consolidation begins.
✅ 2. Consolidation Phase (Flag Formation)
- After the steep drop, the price temporarily moves sideways or slightly upward in a small, controlled range.
- This forms the flag, which is characterized by:
- Parallel trendlines sloping slightly upward or moving sideways.
- Low trading volume, indicating weak buying interest.
- Price failing to break key resistance levels (e.g., moving averages or trendlines).
- This phase tricks some traders into thinking a reversal might happen, but smart traders wait for confirmation before entering trades.
✅ 3. Key Indicators to Confirm the Bearish Flag in Gold
To increase accuracy, traders should use technical indicators to confirm the bearish flag pattern:
📉 Moving Averages:
- 200-period MA: Acts as strong resistance in a downtrend.
- 50-period MA: Helps confirm trend continuation if the price stays below it.
📉 Volume Analysis:
- Decreasing volume during consolidation suggests weak buying pressure.
- Spike in volume during the breakdown confirms the bearish trend continuation.
📉 RSI (Relative Strength Index):
- RSI below 50 indicates continued bearish momentum.
- A sudden drop below 30 suggests a breakout is strong and reliable.
✅ 4. Breakdown of the Flag – Entry Signal for a Short Trade
- The pattern is confirmed when the price breaks below the lower trendline of the flag.
- Ideally, a trader enters a short position after this breakdown, ensuring:
- Volume has increased to validate the breakout.
- Price is staying below major resistance levels (like the 200-MA).
- The stop-loss is set slightly above the flag’s resistance level.
✅ 5. Setting Profit Targets Using the Flagpole
- The target price is determined by measuring the height of the flagpole and projecting it downward from the breakout point.
- For example, if the flagpole height is $30, and the breakout happens at $3,020, the target would be:
- $3,020 – $30 = $2,990
- This method provides traders with a clear and objective exit strategy.
Example of a Bearish Flag on the Gold Chart
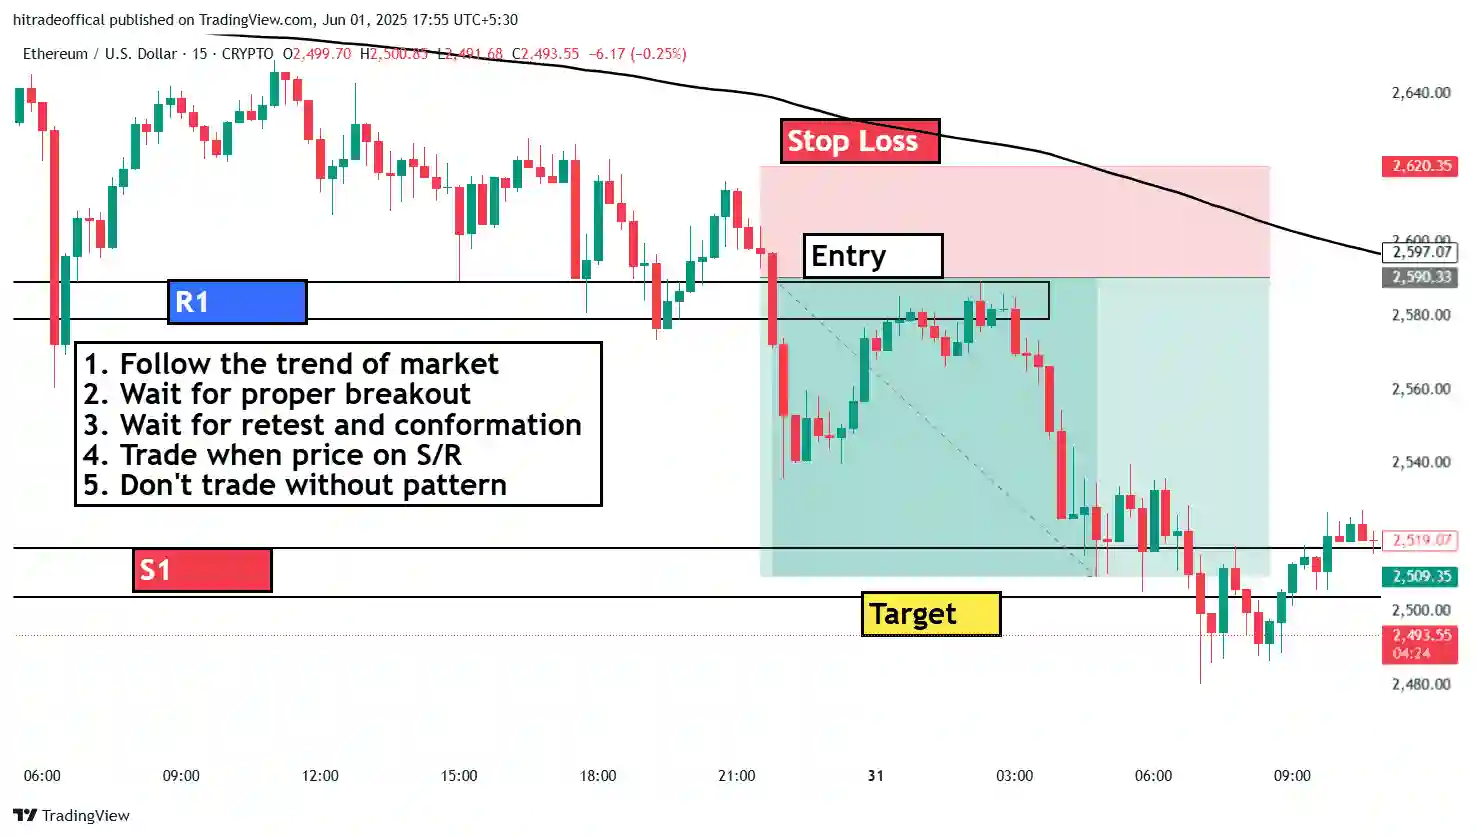
In the provided XAU/USD chart, we see:
📉 A strong downward move (flagpole), indicating heavy selling pressure.
📉 A small consolidation (flag) with price moving slightly upward.
📉 A breakdown of the flag, followed by a sharp decline to the target price.
This setup demonstrates how traders could have used the bearish flag pattern to profit from gold’s downtrend.
For more expert insights and trading strategies, check out HiTrade Official.
4. Key Components of a Bearish Flag: Flagpole, Consolidation, and Breakdown
1. Flagpole – The Initial Strong Downtrend
✔ The bearish flag pattern begins with a sharp and strong downward movement, known as the flagpole.
✔ This move is driven by high selling pressure caused by factors like:
- A strong U.S. dollar (DXY) weakening gold prices.
- Rising interest rates, making non-yielding assets like gold less attractive.
- Market uncertainty, leading to massive sell-offs in commodities.
✔ On a price chart, this appears as a steep decline with large red candlesticks, signaling aggressive bearish momentum.
2. Consolidation – The Flag Formation
✔ After the flagpole, the price enters a temporary consolidation phase, forming a small upward or sideways channel.
✔ Characteristics of this phase include:
- Lower trading volume, indicating reduced buying pressure.
- Price making small higher highs and higher lows, creating the “flag” shape.
- A slight upward slope, often mistaken for a potential reversal but actually a setup for further decline.
✔ This consolidation traps weak buyers, giving professional traders the opportunity to enter short positions at better prices.
3. Breakdown – The Bearish Continuation
✔ The most critical part of the bearish flag pattern is the breakdown below the lower trendline of the flag.
✔ A strong breakout confirmation includes:
- Increased trading volume, proving sellers are regaining control.
- Price breaking below the recent lows, confirming the pattern’s validity.
- Staying below key resistance levels, such as moving averages like the 200-MA and 50-MA.
✔ A successful breakdown leads to further downside movement, allowing traders to ride the trend toward the calculated price target.
How to Trade the Bearish Flag Pattern
✔ Entry: Enter a short trade as soon as the price breaks below the lower boundary of the flag.
✔ Stop-Loss: Place a stop-loss just above the upper trendline of the flag to protect against false breakouts.
✔ Take-Profit Target: Measure the flagpole’s height and project it downward from the breakout point.
Example from the XAU/USD Chart
✔ In the provided gold (XAU/USD) chart, the bearish flag pattern unfolds as follows:
- A steep drop (flagpole), signaling strong selling momentum.
- A small consolidation (flag), creating a deceptive bullish move.
- A breakdown, confirming the continuation of the downtrend and reaching the target price.
Understanding these key components helps traders spot high-probability bearish setups and make informed trading decisions.
For more expert trading insights, visit HiTrade Official.
5. Bearish Flag Trading Strategy: Entry, Stop Loss, and Target
1. Entry Point: When to Open a Trade
✔ The ideal entry point for a bearish flag trade is when price breaks below the lower boundary of the flag.
✔ A confirmed breakdown includes:
- High trading volume, signaling strong selling pressure.
- Large bearish candlestick, closing below the flag’s support line.
- Price staying below key moving averages (50-MA & 200-MA), confirming the trend continuation.
✔ Some traders wait for a retest of the broken flag support before entering to confirm the breakdown is valid.
2. Stop-Loss Placement: Managing Risk
✔ A well-placed stop-loss prevents unexpected reversals from causing major losses.
✔ The stop-loss should be positioned above the flag’s upper boundary, ensuring enough room for minor price fluctuations.
✔ Alternative stop-loss placements:
- Aggressive traders: Slightly above the most recent swing high.
- Conservative traders: Above the entire consolidation zone, providing extra protection against false breakouts.
3. Target Price: Setting the Profit Objective
✔ The price target is determined using the flagpole height method:
- Measure the distance from the start of the flagpole to the bottom of the flag.
- Project this same distance downward from the breakout point.
✔ Example: - If the flagpole height is $30, and the breakdown occurs at $3,020, the target would be $2,990.
✔ Traders can also use support levels or Fibonacci extensions to refine their take-profit targets.
4. Confirmation Indicators for Higher Accuracy
✔ Moving Averages (50-MA & 200-MA): Price staying below these confirms a strong downtrend.
✔ RSI (Relative Strength Index): Below 50, and ideally dropping below 30, signals strong bearish momentum.
✔ Volume Spike: Increased selling volume confirms the pattern’s validity.
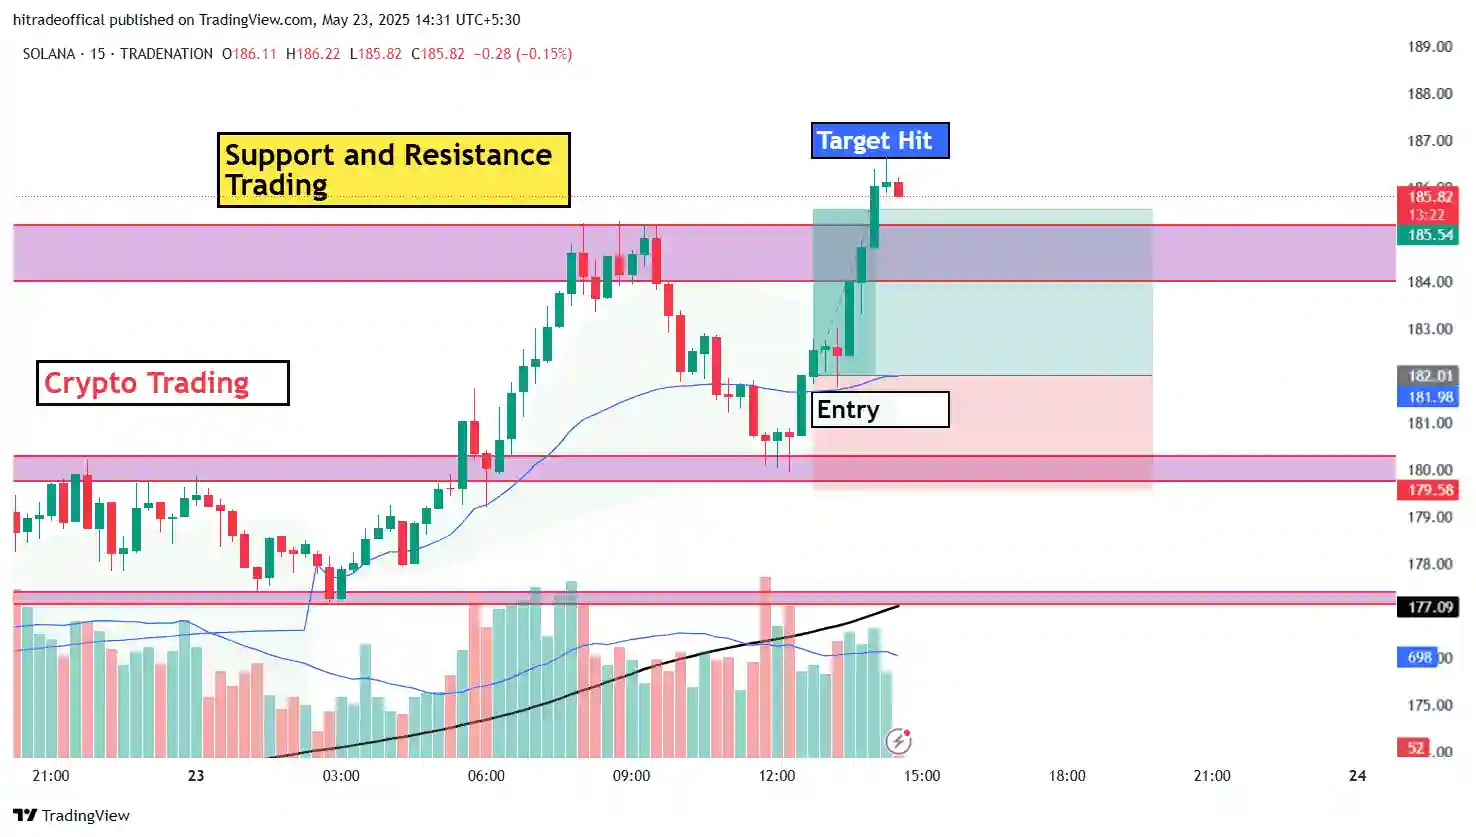
5. Example of a Bearish Flag Trade on Gold (XAU/USD)
✔ The provided gold (XAU/USD) chart illustrates:
- A sharp downward move (flagpole), followed by sideways consolidation (flag).
- A breakdown below support, confirming entry for a short trade.
- Price reaching the calculated target price, completing the pattern.
A well-planned bearish flag trading strategy allows traders to maximize profits while minimizing risks.
For expert trading insights, visit HiTrade Official.
6. Volume Analysis: Confirming the Bearish Flag Breakdown
1. Importance of Volume in a Bearish Flag Pattern
✔ Volume plays a crucial role in confirming the validity of a bearish flag pattern.
✔ A low-volume consolidation followed by a high-volume breakdown increases the probability of a successful bearish continuation.
✔ Without volume confirmation, a breakdown might be a false signal, leading to premature trades.
2. Volume Behavior During Different Phases of the Bearish Flag
📉 During the Flagpole Formation (Strong Downtrend)
- The initial sharp decline (flagpole) should be accompanied by high selling volume.
- This confirms that institutional traders and large market participants are driving the downtrend.
📉 During the Consolidation Phase (Flag Formation)
- Volume declines significantly as price moves in a small range.
- This suggests that buyers are weak, and sellers are waiting for the next breakout.
- A low-volume consolidation is a key characteristic of a valid bearish flag.
📉 During the Breakdown (Bearish Continuation)
- A strong increase in volume when price breaks the lower boundary of the flag confirms a valid breakdown.
- If the breakdown occurs with low volume, it could be a fakeout, leading to a potential price reversal.
3. How to Use Volume Indicators for Confirmation
✔ Volume Bars (Basic Volume Analysis)
- Look for rising volume as the price breaks the flag’s support.
- If volume is weak, wait for further confirmation before entering a trade.
✔ On-Balance Volume (OBV) Indicator
- A declining OBV during the consolidation phase suggests weakening buying pressure.
- A sharp drop in OBV during the breakdown confirms strong selling momentum.
✔ Volume Weighted Average Price (VWAP)
- If price remains below the VWAP line, it indicates that sellers are in control.
- A VWAP rejection after a breakdown further confirms the bearish trend.
4. Example of Volume Confirmation in Gold (XAU/USD)
✔ In the provided XAU/USD chart, we observe:
- High volume during the flagpole, confirming strong bearish momentum.
- Declining volume in the flag phase, indicating a temporary pause before further decline.
- A sudden volume spike during the breakdown, confirming that sellers are regaining control.
5. Trading Strategy Using Volume Analysis
✔ Entry: Enter a short position only if volume increases during the breakdown.
✔ Stop-Loss: Place a stop-loss above the recent consolidation high to avoid fakeouts.
✔ Target Price: Use the flagpole height projection to set realistic profit targets.
Using volume analysis ensures that traders avoid false breakouts and enter high-probability trades.
For expert trading strategies, visit HiTrade Official.
7. Best Timeframes to Trade the Bearish Flag in Forex and Commodities
1. Why Timeframe Selection Matters
✔ The effectiveness of a bearish flag pattern depends on the timeframe you trade.
✔ Larger timeframes provide stronger and more reliable signals, while smaller timeframes offer faster but riskier setups.
✔ Traders should choose a timeframe based on their trading style (scalping, swing trading, or position trading).
2. Best Timeframes for Different Types of Traders
📉 For Scalpers (1-Minute to 15-Minute Charts)
- Scalpers look for quick trades within a short period.
- The 1M, 5M, and 15M timeframes are ideal for catching small bearish flag patterns in fast-moving markets like gold (XAU/USD) and forex pairs.
- Volume confirmation is crucial to avoid false breakouts.
- Best trading sessions:
- London session (7 AM – 10 AM UTC) – High liquidity and volatility.
- New York session (1 PM – 4 PM UTC) – Strong market moves due to news events.
📉 For Intraday and Swing Traders (30-Minute to 4-Hour Charts)
- The 30M, 1H, and 4H timeframes are ideal for traders looking for high-probability trades that last a few hours to days.
- Bearish flag setups on these timeframes provide more reliable breakouts than lower timeframes.
- Best time to trade:
- During market overlaps (London-New York overlap: 12 PM – 4 PM UTC) for high volatility.
- After key economic releases (CPI, NFP, FOMC) to capitalize on trend continuation.
📉 For Position Traders (Daily and Weekly Charts)
- The D1 (Daily) and W1 (Weekly) timeframes are best for long-term traders who hold positions for weeks or months.
- These timeframes provide the most accurate bearish flag signals with strong volume confirmation.
- Best time to trade:
- During major trend reversals driven by fundamental events like interest rate changes and inflation reports.
3. Best Timeframes for Trading Gold (XAU/USD) vs. Forex Pairs
✔ Gold (XAU/USD)
- Works best on the 15M, 1H, and 4H charts for day trading.
- The daily chart (D1) is ideal for long-term bearish flags.
- Most active during the New York session when gold reacts to USD movements.
✔ Forex Pairs (EUR/USD, GBP/USD, USD/JPY, etc.)
- The 5M and 15M timeframes are great for scalping forex.
- The 1H and 4H timeframes provide high-probability swing trades.
- The best time to trade is during major forex session overlaps (London & New York).
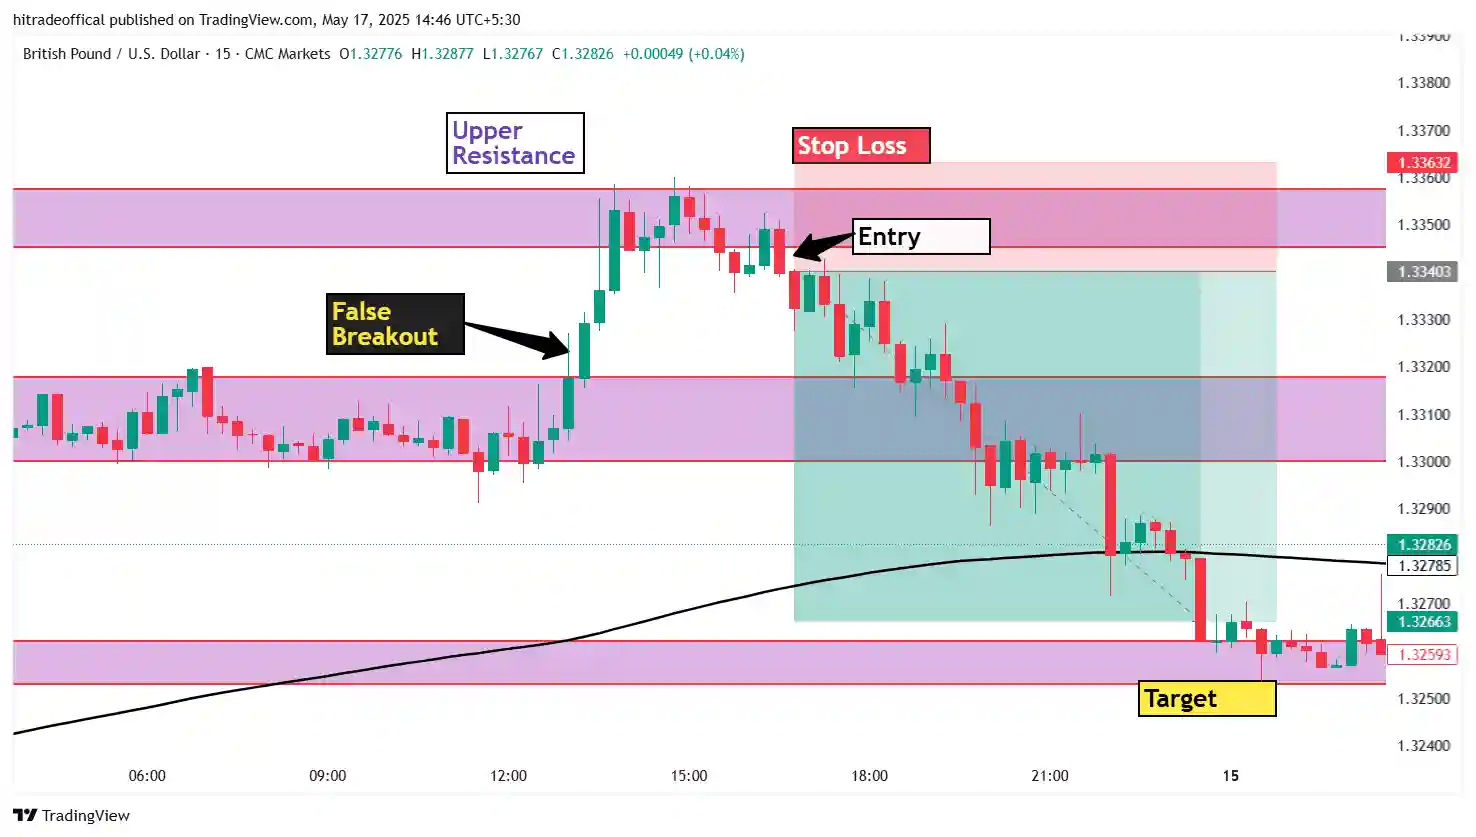
4. Example of a Bearish Flag Setup in XAU/USD
✔ The provided gold (XAU/USD) chart shows a bearish flag pattern on the 1H timeframe.
✔ A strong breakdown below the flag’s lower trendline signals a sell trade, with the 200-MA acting as resistance.
✔ The pattern follows a typical trend continuation move, confirming that the 1H timeframe is effective for intraday trading.
5. Key Takeaways for Traders
✔ Smaller timeframes (1M – 15M) = Higher risk, fast profits (scalping).
✔ Medium timeframes (30M – 4H) = Balance between risk and accuracy (day/swing trading).
✔ Higher timeframes (D1 – W1) = Strong, reliable signals (position trading).
✔ Always confirm with volume, moving averages, and RSI before entering a trade.
For advanced trading strategies, visit HiTrade Official.
8. Bearish Flag Pattern vs. Other Continuation Patterns: Key Differences
1. What is a Continuation Pattern?
✔ A continuation pattern signals that the market will likely continue in its existing trend.
✔ The bearish flag is one of the most powerful continuation patterns, but it is often confused with other patterns like the bear pennant, descending triangle, and falling wedge.
✔ Understanding the differences between these patterns helps traders make accurate trading decisions.
2. Bearish Flag vs. Bear Pennant
📉 Bearish Flag
- Shape: Rectangular channel that slopes slightly upward or sideways.
- Consolidation: The flag forms after a strong downtrend, with price moving in a parallel channel.
- Breakout Direction: Breaks downward when sellers regain control.
- Volume Behavior: High volume in the flagpole, low volume in the flag, and a surge in volume during breakdown.
📉 Bear Pennant
- Shape: Small symmetrical triangle instead of a rectangle.
- Consolidation: Price forms a tightening range with lower highs and higher lows.
- Breakout Direction: Breaks downward when support is lost.
- Volume Behavior: Similar to the bearish flag but with a more compact consolidation.
✔ Key Difference: The bear flag has a rectangular shape, while the bear pennant forms a triangle.
3. Bearish Flag vs. Descending Triangle
📉 Bearish Flag
- Forms after a steep price drop and consolidates in a slightly upward-sloping channel.
- Traders enter short after the flag’s lower boundary breaks.
📉 Descending Triangle
- Forms with a flat bottom (support) and lower highs, creating a triangle pattern.
- The breakout happens below the horizontal support level, confirming further downside.
- Commonly found in longer timeframes like daily or weekly charts.
✔ Key Difference: The bear flag has a diagonal channel, while the descending triangle has a horizontal support line.
4. Bearish Flag vs. Falling Wedge
📉 Bearish Flag
- A continuation pattern that signals trend continuation after consolidation.
- Breakout supports further downside movement.
📉 Falling Wedge
- A reversal pattern that forms after a downtrend, signaling a potential bullish reversal.
- The wedge slopes downward, but price eventually breaks upward.
✔ Key Difference: The bear flag is a bearish continuation pattern, while the falling wedge is a bullish reversal pattern.
5. Which Pattern is More Effective for Trading?
✔ Bearish Flag: Best for short-term and intraday traders looking for a fast breakdown trade.
✔ Bear Pennant: Works well in volatile markets like forex and commodities.
✔ Descending Triangle: Best for longer-term breakdown trades with strong confirmation.
✔ Falling Wedge: Used for counter-trend trading to catch reversals.
6. Example of a Bearish Flag vs. Other Patterns on XAU/USD
✔ In the provided gold (XAU/USD) chart, a bearish flag appears after a strong downward move, leading to further price declines.
✔ Comparing this with a descending triangle, we see that the latter has a flat bottom with lower highs, rather than an upward-sloping flag.
7. Conclusion: Which Pattern Should You Trade?
✔ The bearish flag pattern is one of the most reliable setups for traders looking for trend continuation opportunities.
✔ Always confirm with volume, RSI, moving averages, and price action before entering a trade.
✔ Understanding the differences between continuation patterns helps traders avoid false signals and improve trade accuracy.
For expert trading strategies, visit HiTrade Official.
Conclusion: Mastering the Bearish Flag Pattern for Profitable Trades
The bearish flag pattern is one of the most powerful continuation patterns used by traders in forex, commodities, and stock markets. By understanding its key components—flagpole, consolidation, and breakdown—traders can identify high-probability setups with precise entry, stop-loss, and profit targets.
When combined with volume analysis, key timeframes, and confirmation indicators such as moving averages and RSI, the bearish flag pattern becomes a reliable tool for trend continuation trading. Additionally, differentiating it from other patterns like the bear pennant, descending triangle, and falling wedge helps traders make informed decisions and avoid false signals.
To maximize success when trading the bearish flag on gold (XAU/USD), forex pairs, and commodities, always follow a structured approach:
✔ Identify a strong downtrend leading to a well-defined flag formation.
✔ Confirm the breakdown with increasing volume for a valid entry.
✔ Use technical indicators like VWAP and OBV to strengthen trade confidence.
✔ Select the best timeframe based on your trading style—scalping, swing trading, or position trading.
By mastering the bearish flag pattern and integrating it into your trading strategy, you can increase your chances of catching profitable downside moves while minimizing risk.
For more expert trading insights and strategies, visit HiTrade Official.
Top 10 Questions and Answers About the Bearish Flag Pattern in Trading
1. What is a Bearish Flag Pattern in Trading?
A bearish flag pattern is a continuation pattern that appears after a strong downward move (flagpole) followed by a brief consolidation in a small upward or sideways channel (flag). Once the price breaks below the flag’s lower boundary, the downtrend continues.
2. How Do You Identify a Bearish Flag on a Price Chart?
To identify a bearish flag:
✔ Look for a strong downtrend (flagpole) before the pattern forms.
✔ Identify a small upward-sloping or sideways channel representing consolidation.
✔ Watch for a breakdown below the flag’s support line with high volume, confirming the continuation of the downtrend.
3. What is the Difference Between a Bearish Flag and a Bear Pennant?
The bearish flag forms a rectangular consolidation channel, while the bear pennant forms a symmetrical triangle. Both indicate trend continuation, but a pennant has a more compact shape with converging trendlines.
4. How Reliable is the Bearish Flag Pattern in Forex and Gold Trading?
The bearish flag is a high-probability pattern, especially when confirmed with:
✔ High volume during the flagpole and low volume during consolidation.
✔ Breakdown with strong volume, confirming a valid trade setup.
✔ Key technical indicators like RSI, moving averages, and Fibonacci retracements for added confirmation.
5. What Are the Best Timeframes to Trade a Bearish Flag?
✔ Scalpers use 1M, 5M, and 15M timeframes for quick trades.
✔ Swing traders prefer 1H and 4H timeframes for medium-term setups.
✔ Position traders use D1 and W1 charts for stronger, long-term patterns.
6. How Do You Trade a Bearish Flag Pattern Effectively?
To trade a bearish flag:
✔ Entry: Enter a short trade after the breakdown of the flag’s lower boundary.
✔ Stop-Loss: Place a stop above the flag’s recent highs to minimize risk.
✔ Take Profit: Measure the flagpole length and project it downward to estimate the target.
7. How Important is Volume in Confirming a Bearish Flag?
✔ High volume during the flagpole signals strong selling pressure.
✔ Low volume during the flag formation suggests weak buying interest.
✔ A surge in volume at the breakdown confirms a genuine bearish continuation.
8. What Indicators Can Be Used to Confirm a Bearish Flag Breakdown?
✔ Moving Averages (50 EMA & 200 EMA): Price staying below key MAs strengthens the bearish trend.
✔ RSI (Relative Strength Index): An RSI below 40-30 supports bearish momentum.
✔ MACD (Moving Average Convergence Divergence): A bearish crossover enhances confidence in the downtrend.
9. Can the Bearish Flag Pattern Fail? If Yes, How?
Yes, a bearish flag can fail if:
✔ The breakdown happens with low volume, leading to a false signal.
✔ Market sentiment shifts due to fundamental news, reversing the trend.
✔ Key support levels hold, preventing further downside movement.
10. Where Can I Learn More About Trading Bearish Flags?
For in-depth guides and live market examples, visit:
✔ HiTrade Official – Expert trading insights.
✔ TradingView – Live price charts and pattern analysis.
✔ Investopedia – Educational resources on technical analysis.