Introduction :-
The Double Top pattern is a key bearish reversal formation that helps traders identify potential trend shifts. By understanding resistance levels, breakout confirmations, and risk management strategies, traders can maximize profits and minimize risks. Learn to trade it effectively with expert insights at HiTrade Official. 🚀
Understanding the Double Top Pattern and Its Market Significance
The Double Top pattern is a well-known technical analysis formation that signals a potential trend reversal from bullish to bearish. It appears when an asset’s price reaches a high point (Top 1), retraces to a support level, and then attempts to rise again but fails to break above the previous high (Top 2). This failure indicates a loss of buying momentum and an increase in selling pressure, leading to a downward price movement.
Why is the Double Top Pattern Important?
The Double Top is considered a strong reversal signal because it highlights a significant shift in market sentiment. Traders and investors use it to identify potential shorting opportunities and manage risk effectively. This pattern often occurs in commodities like crude oil and natural gas, stocks, forex, and indices.
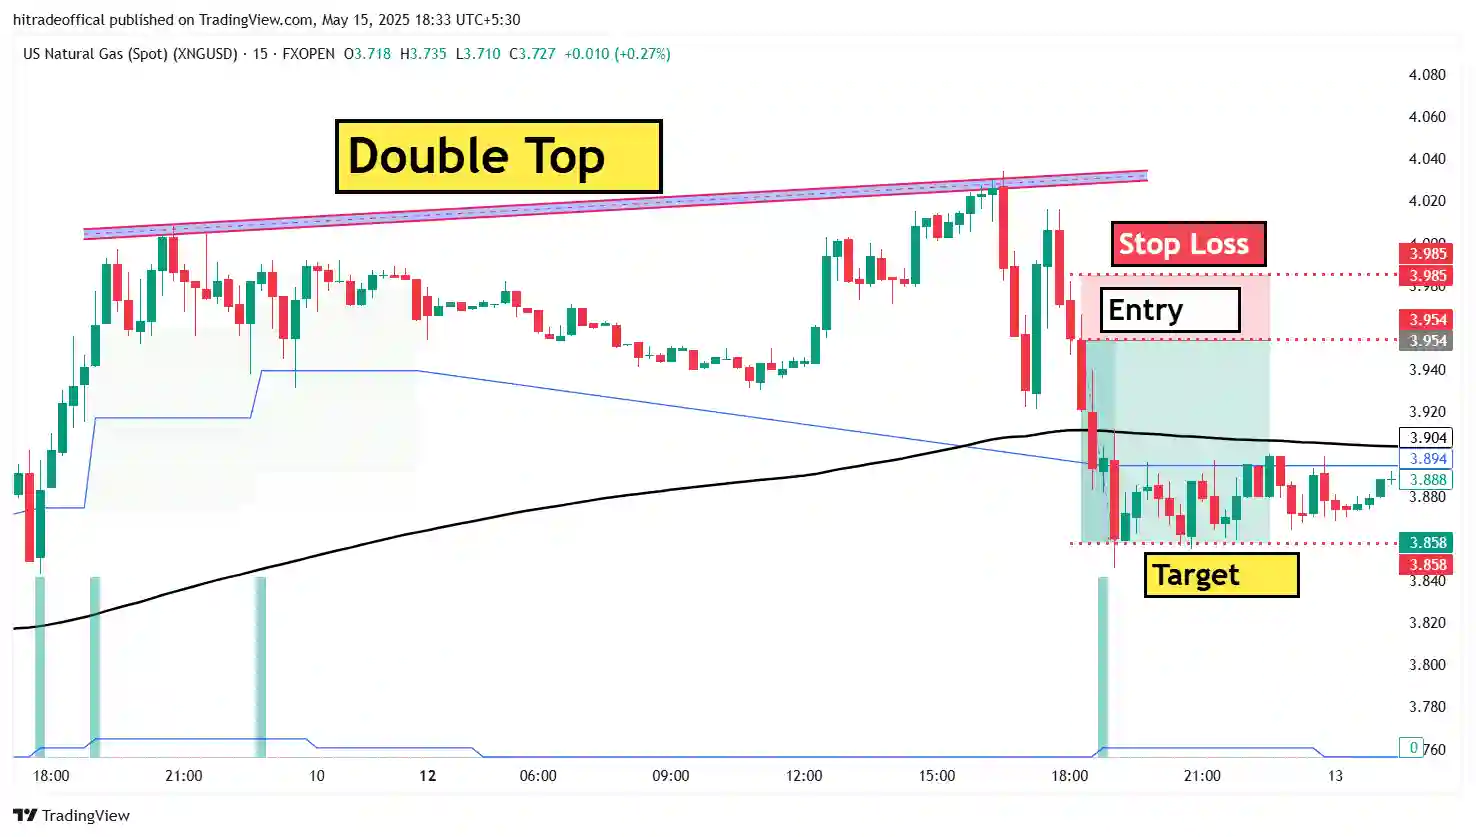
For instance, in the natural gas market (XNGUSD), as shown in the image above, the price attempted to break resistance twice but failed, leading to a breakout below the support level. This setup is crucial for traders looking to enter short positions at the right time.
How to Confirm a Double Top Pattern?
To ensure the Double Top is valid, traders should look for additional confirmations such as:
- Decreasing Volume: A decline in volume on the second peak suggests weak buying interest.
- Neckline Breakout: The pattern is confirmed when the price breaks below the support level (neckline) with strong volume.
- Technical Indicators: Tools like RSI (Relative Strength Index) and MACD (Moving Average Convergence Divergence) can help confirm the reversal.
For a deeper understanding of trend reversal patterns, check out this guide on technical analysis of price action.
Trading Strategies Using the Double Top Pattern
- Entry Point: Traders enter a short position when the price breaks below the neckline.
- Stop-Loss Placement: A stop-loss is placed slightly above the second peak to avoid false breakouts.
- Profit Target: A common strategy is to measure the height of the pattern and project it downward for the target price.
Traders also use moving averages, such as the 50-day and 200-day EMA, to confirm long-term trend shifts. Learn more about trading strategies using moving averages
Final Thoughts
The Double Top pattern is a crucial tool for traders who rely on technical analysis to predict market movements. It helps in identifying potential reversal points, reducing risks, and increasing profitability. By combining this pattern with volume analysis, indicators, and strong risk management, traders can significantly improve their trading decisions.
For more insights into price action trading and market trends, visit HiTrade Official. 🚀
How to Identify Key Resistance Levels in a Double Top Formation
The Double Top pattern is a critical reversal signal in technical analysis, and correctly identifying key resistance levels within this formation can enhance trading accuracy. The resistance level in a Double Top is the price point where the asset faces repeated selling pressure, preventing further upward movement. Traders must identify this level precisely to spot potential reversals and place strategic trades.
In a Double Top, the resistance level is formed when the price reaches a peak (Top 1), retraces, and then returns to the same high (Top 2) but fails to break above it. This repeated failure signals a strong supply zone where sellers overpower buyers, leading to a potential downward move.
Example in the natural gas market (XNGUSD), as seen in the provided image, the price tested the resistance level twice before reversing sharply. For a complete guide on resistance levels and how they impact trading, check out this resource Technical Analysis of Resistance and Support
Methods to Identify Resistance Levels in a Double Top
Price Action Analysis involves observing candlestick patterns near the resistance level to provide confirmation. Look for long wicks, rejection candles, or bearish engulfing patterns near the second top
Historical Resistance Zones help in checking past price movements to see if the same level has acted as resistance before. The more times a level is tested, the stronger it becomes
Volume Analysis in a Double Top with decreasing volume on the second peak suggests buyer exhaustion, reinforcing the resistance level. A breakdown below support with a volume spike confirms the pattern. Learn more about volume and price action trading at Stock Bharti
Moving Averages and Indicators such as the 200-Day EMA confirm strong resistance when the price struggles near it. RSI (Relative Strength Index) near 70 at the second top signals overbought conditions, increasing the probability of a reversal. MACD (Moving Average Convergence Divergence) bearish crossover near resistance strengthens the reversal confirmation
Trading Strategies Using Resistance in a Double Top
Short Entry when the price fails to break resistance and forms bearish confirmation candles. Stop-Loss Placement should be slightly above the resistance level to avoid false breakouts. Profit Target can be set by measuring the height of the Double Top and projecting it downward. For advanced trading strategies, explore this in-depth guide How to Trade Market Reversals
Identifying key resistance levels in a Double Top pattern is crucial for traders looking to capitalize on trend reversals. By combining price action, volume analysis, and technical indicators, traders can make well-informed decisions and minimize risks. Stay updated with expert market analysis at HiTrade Official and sharpen your trading skills
Confirming a Double Top: Essential Technical Indicators to Watch
A Double Top pattern is a strong bearish reversal signal, but confirming it with technical indicators ensures higher accuracy in trading decisions. Simply spotting two peaks is not enough; traders need confirmation through key indicators before executing trades. Here’s a breakdown of essential indicators that validate a Double Top formation and help traders avoid false signals.
1. Price Action and Candlestick Patterns
Observing price behavior at the second peak is crucial. A strong rejection candle such as a bearish engulfing, shooting star, or evening star at the resistance level signals that sellers are taking control. Additionally, the second peak should show a weaker upward momentum compared to the first, indicating buyer exhaustion. Learn more about price action trading techniques at Stock Bharti.
2. Volume Analysis for Confirmation
Volume plays a significant role in confirming a Double Top. Ideally, the first peak should have high volume, while the second peak should form with lower volume, indicating that buyers are losing strength. A volume spike on the breakdown below the neckline (support level) confirms the pattern and signals strong bearish momentum. For an in-depth guide on volume analysis, check HiTrade Official.
3. Relative Strength Index (RSI) and Overbought Conditions
The RSI helps confirm a Double Top by showing divergence. If the price forms two peaks but the RSI forms a lower high, it signals weakening momentum and a potential reversal. Additionally, RSI levels above 70 at the second peak indicate overbought conditions, increasing the chances of a trend reversal.
4. Moving Averages as Dynamic Resistance
Key moving averages, such as the 50-day or 200-day EMA, can act as resistance levels. If the price struggles to move above a significant moving average during the formation of the second peak, it strengthens the validity of the Double Top pattern.
5. MACD Bearish Crossover for Stronger Confirmation
A bearish crossover in the Moving Average Convergence Divergence (MACD) indicator occurs when the MACD line crosses below the signal line. If this crossover happens near the second peak or after the breakdown, it confirms bearish momentum and validates the Double Top.
6. Neckline Breakdown and Retest Strategy
The neckline is the support level connecting the lows between the two peaks. A strong Double Top confirmation occurs when the price breaks below the neckline with high volume. Additionally, if the price retests this broken support level and fails to move above it, it offers an ideal entry for short trades.
7. Fibonacci Retracement for Measuring Reversal Strength
Using Fibonacci retracement, traders can gauge potential reversal zones. If the second peak aligns with the 61.8% or 78.6% Fibonacci retracement level of the previous uptrend, it adds confluence to the Double Top formation.
8. ATR (Average True Range) for Volatility Check
The ATR helps measure market volatility. If the breakdown occurs with an increasing ATR, it confirms that the market has strong momentum and reduces the chances of a false breakout.
Conclusion
Confirming a Double Top with multiple technical indicators significantly improves the accuracy of trading decisions. By analyzing price action, volume, RSI, moving averages, and other key tools, traders can confidently trade market reversals while minimizing risk. Stay ahead in trading by following expert insights at HiTrade Official and Stock Bharti.
Breakout Strategies: How to Trade the Double Top Pattern Effectively
The Double Top pattern is one of the most reliable bearish reversal formations, indicating a potential shift in market direction. However, trading it effectively requires a well-structured breakout strategy to minimize risk and maximize profit potential. Here’s how to execute high-probability trades using the Double Top pattern.
1. Identifying the Double Top Formation
Before planning a trade, ensure that the price has formed two distinct peaks at approximately the same resistance level, with a clear neckline acting as support. The second top should show signs of weakening bullish momentum, such as smaller candlestick bodies or wicks rejecting higher prices. Learn more about pattern identification at Stock Bharti.
2. Volume Confirmation for Breakout Strength
A true Double Top breakdown occurs when price breaches the neckline with increased volume. If the breakout happens on low volume, it might be a false signal. High trading volume on the breakdown confirms strong selling pressure and a genuine trend reversal. Find more insights on volume-based trading at HiTrade Official.
3. Entry Strategies for Double Top Breakouts
- Aggressive Entry: Enter a short position as soon as the price closes below the neckline with a strong bearish candle and high volume. This method offers early trade execution but comes with higher risk if a retest occurs.
- Conservative Entry: Wait for a retest of the neckline after the breakdown. If the price struggles to reclaim the previous support (now resistance), it confirms the bearish bias, making it a safer entry point.
4. Stop-Loss Placement to Manage Risk
To protect against false breakouts, a stop-loss should be placed slightly above the second top or just above the retest zone if entering after confirmation. This minimizes losses if the price unexpectedly moves back above the neckline.
5. Target Profit Levels Using Fibonacci Extensions
A common price target for Double Top trades is the measured move projection. Measure the height from the tops to the neckline and project the same distance downward from the breakdown point. Additionally, Fibonacci extensions (like 127.2% or 161.8%) can provide strategic profit-taking levels.
6. Moving Averages as Dynamic Confirmation
A price breakdown below the 50-day or 200-day moving average further strengthens the bearish trend. Traders can use these levels as trailing stop references or additional confluence for their trades.
7. Combining RSI and MACD for Confirmation
- RSI Divergence: If the second top forms with a lower RSI reading, it confirms weakening bullish strength, increasing the chances of a successful breakdown.
- MACD Bearish Crossover: A MACD line crossing below the signal line near the breakout point validates the downward move and enhances trade confidence.
8. Monitoring Market Sentiment and News Impact
External factors, such as economic data or geopolitical events, can influence market trends. Before entering a trade, check if any fundamental news could disrupt the technical pattern. Stay updated with reliable market news sources like Investing.com or HiTrade Official.
Conclusion
Trading the Double Top pattern effectively requires patience and confirmation. By waiting for volume-backed breakouts, using technical indicators for validation, and applying proper risk management, traders can increase their success rate. Explore more trading strategies and real-market case studies at HiTrade Official.
Risk Management Tips When Trading a Double Top Reversal
Trading a Double Top reversal offers strong profit potential, but without proper risk management, traders risk significant losses. Implementing a structured risk management strategy helps preserve capital and maximize profitability. Below are essential risk management techniques for trading a Double Top pattern.
1. Set a Stop-Loss Above the Second Peak
A well-placed stop-loss prevents excessive drawdowns. Ideal stop-loss levels include:
- Above the Second Top: Prevents getting stopped out prematurely if price briefly moves higher.
- Above the Retest Zone: If entering after a neckline retest, this ensures better trade security.
Using the ATR (Average True Range) indicator helps determine dynamic stop-loss levels based on market volatility. Learn more about ATR-based risk strategies at Investopedia.
2. Manage Risk with Proper Position Sizing
To protect your trading capital, never risk more than 1-2% of your total capital on a single trade. Calculating your position size based on the difference between your entry and stop-loss ensures that one bad trade won’t significantly impact your account.
For more advanced position-sizing techniques, visit HiTrade Official.
3. Wait for Volume Confirmation Before Entering
A strong Double Top breakout should be accompanied by high trading volume. If the price breaks below the neckline with low volume, it may be a false breakout. Waiting for volume confirmation reduces the risk of premature entries.
For real-time volume analysis and trade insights, check out TradingView.
4. Avoid Trading Before a Confirmed Breakdown
Many traders enter a short position before the neckline breaks, leading to unnecessary stop-loss hits due to false breakouts. Always wait for a strong bearish candle close below the neckline before entering.
For expert analysis on confirmation strategies, visit HiTrade Official.
5. Maintain a Favorable Risk-to-Reward Ratio
A proper risk-to-reward ratio (RRR) ensures profitability over time. Ideally, use a 1:2 or higher RRR, meaning for every $1 risked, aim for at least $2 in profit. Common targets for Double Top trades include:
- Target 1: The measured move of the Double Top projected downward.
- Target 2: Fibonacci extensions like 127.2% or 161.8% of the pattern’s height.
6. Align with Market Trends for Higher Accuracy
A Double Top setup is stronger when it aligns with the overall market trend. If the broader market is bullish, the pattern may fail. Confirm using moving averages and trend indicators before entering a trade.
Stay updated with market trends on Investing.com.
7. Control Emotions and Stick to Your Plan
Emotional trading often leads to revenge trading, overtrading, and poor risk decisions. A structured trading plan helps avoid impulsive decisions and unnecessary losses. Accept small losses as part of a long-term strategy.
For trading psychology insights, explore resources at HiTrade Official.
8. Use Hedging Strategies for Additional Protection
Experienced traders use hedging techniques, such as options trading or correlated asset strategies, to reduce risk exposure. For example, if shorting Natural Gas (XNG/USD) based on a Double Top, hedging with an energy stock or an options contract can minimize downside risk.
Learn more about advanced hedging at Investopedia.
Final Thoughts
Risk management is the foundation of profitable trading. By placing strategic stop-losses, managing position sizes, waiting for volume confirmation, and using a disciplined trading approach, traders can increase their profitability while minimizing unnecessary losses. Stay updated with more trading insights at HiTrade Official.
The Role of Moving Averages in Double Top Breakout Confirmation
Moving averages play a crucial role in confirming a Double Top breakout, helping traders filter false signals and identify strong trend reversals. By analyzing moving average interactions with price action, traders can gain higher confidence in their trade entries and exits. Here’s how moving averages enhance Double Top breakout confirmation.
1. Identifying Trend Reversals with Moving Averages
A Double Top pattern signals a potential trend reversal from bullish to bearish. However, to confirm the breakdown, traders should observe whether the price falls below key moving averages like the 50-day and 200-day moving averages (MAs).
- If the price breaks below the 50-day MA, it suggests a short-term trend shift.
- If the price breaks below the 200-day MA, it confirms a long-term bearish trend.
- A death cross (when the 50-day MA crosses below the 200-day MA) further strengthens bearish momentum.
To learn more about moving averages in trading, visit Investopedia.
2. Using the 20 & 50 EMA for Early Signal Confirmation
The Exponential Moving Average (EMA) reacts faster to price changes, making it useful for early breakout confirmation. A typical strategy involves:
- Watching if the price stays below the 20 EMA after breaking the neckline, confirming sustained bearish pressure.
- Observing a crossover of the 20 EMA below the 50 EMA, signaling continued downside momentum.
For real-time moving average insights, check HiTrade Official.
3. Acting as Dynamic Resistance After Breakdown
Once a Double Top breakdown occurs, moving averages act as dynamic resistance levels where price pullbacks may get rejected. Traders can:
- Short on retests of the 50-day MA if the price struggles to break back above it.
- Confirm a bearish trend if the 20 EMA holds as resistance, indicating sellers remain in control.
For more technical analysis tools, visit TradingView.
4. Combining Moving Averages with RSI & MACD for Confluence
For stronger confirmation, moving averages should be used alongside other indicators:
- RSI Divergence: If RSI shows lower highs while price forms a Double Top, it strengthens the reversal signal.
- MACD Bearish Crossover: When the MACD line crosses below the signal line after a breakdown, it confirms downward momentum.
5. Stop-Loss and Entry Strategies Based on Moving Averages
Moving averages also assist in trade execution and risk management:
- Aggressive Entry: Enter short when price closes below the 50-day MA with strong volume.
- Conservative Entry: Wait for a pullback to the 50-day MA, ensuring it acts as resistance before shorting.
- Stop-Loss Placement: A stop-loss can be set above the 50-day MA to avoid getting trapped in a false breakdown.
Final Thoughts
Moving averages provide powerful confirmation signals for trading a Double Top breakout. By combining them with volume analysis, RSI, and MACD, traders can improve accuracy and reduce the risk of false breakouts. For more in-depth market strategies, visit HiTrade Official.
Common Mistakes Traders Make with Double Top Patterns and How to Avoid Them
The Double Top pattern is a highly effective reversal formation, but many traders misinterpret its signals, leading to unnecessary losses. Understanding these common mistakes and learning how to avoid them can improve trade accuracy and profitability.
1. Entering the Trade Too Early Without Confirmation
One of the biggest mistakes traders make is shorting too early, assuming the second peak confirms a downtrend. However, a Double Top is only valid when price breaks below the neckline support.
✅ Solution: Always wait for a confirmed breakdown below the neckline with strong bearish momentum before entering a short position. Learn more about confirmation signals at HiTrade Official.
2. Ignoring Volume During the Breakdown
A true Double Top breakout should be accompanied by high trading volume. If the price breaks below the neckline with low volume, it increases the risk of a false breakdown and potential reversal.
✅ Solution: Use volume indicators like the On-Balance Volume (OBV) or Volume Oscillator to confirm selling pressure before entering a trade. For real-time volume analysis, check TradingView.
3. Setting Stop-Loss Too Close to the Neckline
Many traders set their stop-loss orders too close to the neckline, making them vulnerable to minor pullbacks before the actual move.
✅ Solution: Place the stop-loss above the second peak or above the nearest resistance level to avoid premature stop-outs. Use the ATR (Average True Range) indicator for dynamic stop-loss placement.
4. Not Considering Market Trends
A Double Top pattern is more reliable when it aligns with the broader market trend. If the overall trend is bullish, a Double Top in isolation may not hold.
✅ Solution: Use moving averages like the 50-day and 200-day MAs to confirm the broader trend before placing a trade. If the 50-day MA is sloping upward, the pattern may not lead to a strong breakdown. Learn more at Investing.com.
5. Misidentifying the Pattern in a Choppy Market
Traders often mistake random price fluctuations for a valid Double Top. If the peaks are not clearly defined and the neckline is not well-established, it may be a false setup.
✅ Solution: Use Fibonacci retracement levels and trendlines to ensure a clear pattern before trading. Check the market structure and wait for a confirmed neckline break before entering.
6. Overlooking Retests and False Breakouts
Many traders rush into a breakout trade, only to get caught in a false breakdown, where the price quickly reverses above the neckline.
✅ Solution: A safer strategy is to wait for a retest of the neckline before entering. If the price pulls back to the neckline and gets rejected, it confirms the breakdown. Learn how to trade retests at HiTrade Official.
7. Risking Too Much Capital Per Trade
Overleveraging or risking too much per trade can lead to significant losses if the trade goes against you.
✅ Solution: Follow the 1-2% risk rule, meaning never risk more than 1-2% of your trading capital on a single trade. Use position sizing calculators to determine the safest lot size for your account.
Final Thoughts
Avoiding these common mistakes can improve trading accuracy and reduce unnecessary losses when trading a Double Top pattern. By focusing on confirmation signals, volume analysis, proper risk management, and broader market trends, traders can maximize profits while minimizing risks. Stay updated with expert market insights at HiTrade Official.
Real-World Example: Analyzing a Double Top Breakdown in Natural Gas Trading
A Double Top pattern is a powerful reversal signal, and when applied to Natural Gas (XNG/USD) trading, it can help traders anticipate significant market moves. In this example, we analyze a real Double Top breakdown in Natural Gas prices, demonstrating key insights for profitable trading.
1. Identifying the Double Top Formation
In Natural Gas price action, a Double Top pattern formed at a key resistance level, indicating buying exhaustion. The two peaks had similar highs, and the price failed to break higher, signaling potential bearish momentum. Traders who recognized this formation could have prepared for a breakdown.
📌 Tip: Always ensure the two peaks occur near the same resistance zone, confirming the Double Top structure. Check HiTrade Official for advanced pattern analysis.
2. Confirming the Breakdown with Volume and RSI
Once the price approached the neckline support, traders needed confirmation signals before entering a short position. The key indicators included:
- Volume Surge: A strong increase in volume as the price broke below the neckline, confirming selling pressure.
- RSI Bearish Divergence: The Relative Strength Index (RSI) showed lower highs, indicating fading bullish strength.
✅ Confirmation Strategy: If the breakdown occurs on high volume with RSI below 50, it strengthens the bearish case. Read more on Investing.com.
3. Trading the Breakout: Entry, Stop-Loss, and Target
Once the breakdown was confirmed, traders could enter a short position below the neckline. Here’s how an ideal trade setup would look:
🔹 Entry: Short position below the neckline after a confirmed candle close.
🔹 Stop-Loss: Placed above the second peak or the 50-day moving average to prevent premature exits.
🔹 Take Profit Levels:
- Target 1: Distance from neckline to peaks projected downward.
- Target 2: Fibonacci extension 127.2% or 161.8% for additional profits.
Learn more about setting profit targets at HiTrade Official.
4. Managing Risk and Avoiding False Breakouts
One major risk in trading a Double Top is a false breakout, where price breaks the neckline but quickly reverses. To avoid this:
- Wait for a Retest: If the price retests the neckline and gets rejected, it confirms the downtrend.
- Use Moving Averages: If price stays below the 20-day EMA, it strengthens bearish sentiment.
- Monitor Market Trends: If the broader energy market is bearish, the Double Top has a higher chance of success.
Check TradingView charts for live Natural Gas analysis at TradingView.
Final Thoughts
This real-world Double Top breakdown in Natural Gas demonstrates how traders can use technical analysis, volume confirmation, and risk management to improve their trading success. By following a structured approach, traders can capitalize on market reversals while avoiding false signals. Stay updated with expert insights at HiTrade Official.
Mastering the Double Top Pattern: Key Takeaways for Successful Trading
The Double Top pattern is a powerful trend reversal signal, but its effectiveness depends on proper identification, confirmation, and execution. Traders must avoid common mistakes like entering too early, ignoring volume confirmation, and placing stop-loss orders too close to the neckline.
Using technical indicators such as moving averages, RSI, MACD, and volume analysis enhances the accuracy of Double Top breakouts. A well-structured risk management plan, including stop-loss placement above key resistance levels and position sizing strategies, helps minimize losses.
Real-world applications, such as Natural Gas (XNG/USD) trading, demonstrate how the Double Top pattern can be used to identify high-probability short opportunities. By waiting for a confirmed neckline break, monitoring retests, and aligning trades with broader market trends, traders can maximize profits while reducing risks.
To stay updated with advanced technical analysis strategies, visit HiTrade Official and enhance your trading success with expert insights.
Top 10 FAQs About Trading the Double Top Pattern
1. What is a Double Top Pattern and How Does It Indicate a Trend Reversal?
A Double Top pattern is a bearish reversal formation that occurs after an uptrend, featuring two peaks at a similar level followed by a break below the neckline. This signals buying exhaustion and a potential downtrend. Traders should confirm with volume analysis and technical indicators before entering short positions.
2. How Can Traders Identify a Valid Double Top Pattern?
To confirm a valid Double Top, traders should look for:
- Two distinct peaks at a resistance level.
- A neckline support level below the peaks.
- A break below the neckline with high volume for confirmation.
- Additional confluence from RSI, MACD, and moving averages.
3. What Are the Key Resistance Levels in a Double Top Formation?
The first and second peaks represent strong resistance zones. If price struggles to break above these levels, it indicates seller dominance. Traders can use Fibonacci retracement levels and pivot points to strengthen resistance analysis. Learn more at HiTrade Official.
4. How Can Moving Averages Help Confirm a Double Top Breakdown?
Moving averages act as trend confirmation tools in a Double Top breakout:
- If price stays below the 50-day MA, it signals sustained bearish momentum.
- A death cross (50-day MA below 200-day MA) further confirms the downtrend.
- The 20-day EMA acting as dynamic resistance strengthens the bearish case.
5. What Role Does Volume Play in Double Top Breakout Confirmation?
Volume is critical in confirming a Double Top breakdown:
- A high-volume breakdown below the neckline indicates strong bearish sentiment.
- Low volume may suggest a false breakdown and a potential price reversal.
- Using On-Balance Volume (OBV) or Volume Profile can help assess market participation.
6. What Are the Best Trading Strategies for a Double Top Breakdown?
Traders can short the market after a confirmed neckline break:
- Aggressive Entry: Short immediately after the neckline break with high volume.
- Conservative Entry: Wait for a retest of the neckline as new resistance.
- Stop-Loss Placement: Set stop-loss above the second peak to minimize risk.
7. How Can Traders Avoid False Breakouts in a Double Top Setup?
False breakouts occur when price briefly breaks the neckline but reverses upward. To avoid this:
- Confirm breakdowns with RSI divergence and MACD crossover.
- Ensure price remains below key moving averages.
- Wait for a retest failure at the neckline before entering short trades.
8. What Are the Most Common Mistakes Traders Make with Double Tops?
- Shorting too early without waiting for confirmation.
- Ignoring volume signals, leading to false entries.
- Setting tight stop-losses, resulting in early exits.
- Overlooking the broader market trend, which impacts pattern reliability.
9. How Can Risk Management Improve Trading Success in a Double Top Breakdown?
Risk management is key to successful trading:
- Use the 1-2% risk rule to prevent large losses.
- Place stop-loss above the second peak or a key moving average.
- Take profit at measured move targets or Fibonacci extensions for optimal exit points.
10. Where Can Traders Find Real-World Examples of Double Top Breakdowns?
For live Double Top trading setups, check advanced technical analysis charts on:
- HiTrade Official for expert breakdowns.
- TradingView for real-time charting tools.
- Investing.com for market insights and price action strategies.
By mastering the Double Top pattern, traders can enhance trend reversal identification and execute profitable trades with confidence.