Introduction
Crude oil trading is one of the most volatile and profitable markets, attracting traders worldwide. To succeed in this market, understanding support and resistance strategies is crucial. These key technical analysis tools help traders identify potential price reversal zones, breakouts, and trend continuation points.
In this guide, we will explore how to effectively trade crude oil using support and resistance levels, backed by real chart examples. Whether you are a beginner or an experienced trader, mastering these strategies can improve your trade accuracy and risk management. Let’s dive into the fundamentals and advanced techniques that can help you make informed trading decisions in the crude oil market.
Understanding Support and Resistance in Trading
Support and resistance are fundamental concepts in technical analysis that help traders predict price movements. These levels act as psychological barriers where buying or selling pressure is strong enough to cause a reversal or consolidation in price.
What is Support?
Support is a price level where demand is strong enough to prevent the asset from falling further. When the price reaches this zone, buyers step in, creating upward momentum.
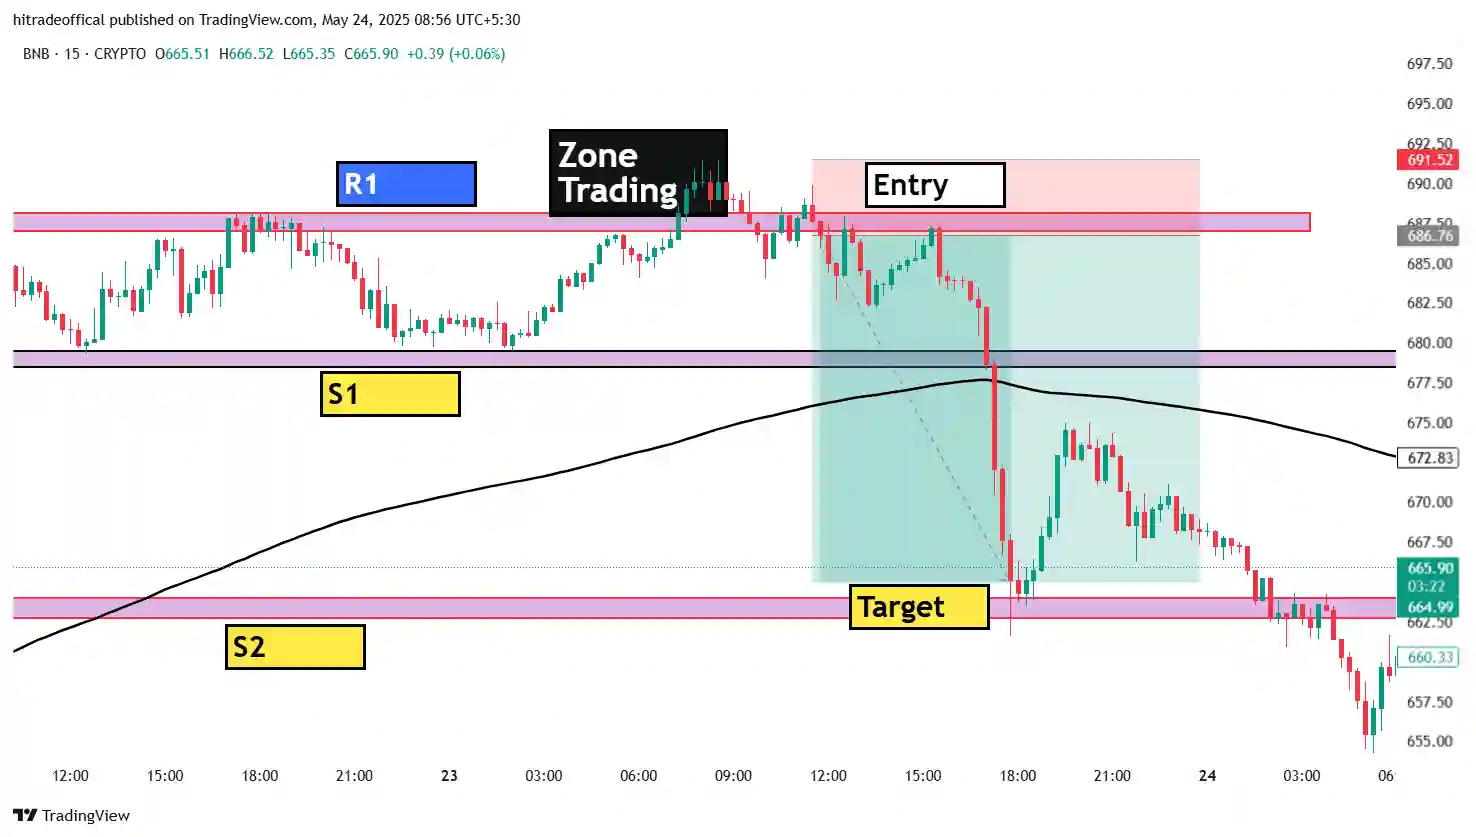
🔹 Example: In the provided Crude Oil Trading Chart, the B1 and B2 zones act as strong support areas where price rebounded after testing multiple times.
What is Resistance?
Resistance is the opposite of support. It’s a level where selling pressure prevents the price from rising further. Once the price reaches this area, sellers overpower buyers, often leading to a price decline.
🔹 Example: The highlighted resistance zone in the chart shows multiple rejections, indicating strong selling pressure.
Why Are Support & Resistance Important?
✔️ Helps traders identify potential entry and exit points
✔️ Provides risk management by setting stop-loss levels
✔️ Enhances the accuracy of trend analysis
Additional Learning Resources:
- How to Use Support & Resistance in Trading (Investopedia)
- Advanced Support & Resistance Strategies (HiTrade Official)
By mastering support and resistance, traders can improve their market predictions and trade with confidence. 🚀
Key Support and Resistance Zones in Crude Oil Charts
Identifying key support and resistance zones is essential for successful crude oil trading. These levels help traders spot potential reversals, breakouts, and trend continuations.
How to Identify Key Support & Resistance Zones
- Historical Price Levels – Look for areas where price has previously reversed multiple times.
- Round Numbers – Psychological levels like $65, $70, or $75 often act as strong support/resistance.
- Moving Averages – Indicators like the 50-day and 200-day moving averages can help confirm support and resistance.
- Volume Analysis – High trading volume near these levels adds strength to the zones.
Example from the Crude Oil Chart
🔹 Support Zone – The B1 & B2 levels in the provided chart show strong buying pressure where price rebounded multiple times.
🔹 Resistance Zone – The upper marked area demonstrates repeated price rejections, signaling strong selling pressure.
How to Trade Support & Resistance Zones?
✔️ Buy near support with a stop-loss below the level
✔️ Sell near resistance with a stop-loss above the level
✔️ Trade breakouts by entering when price closes above resistance or below support
More Learning Resources:
- Support & Resistance Trading Guide (BabyPips)
- Crude Oil Trading Strategies (HiTrade Official)
By mastering these zones, traders can enhance their crude oil trading strategies and improve profitability. 🚀
How to Identify Strong Support Levels (B1 & B2 Case Study)
Strong support levels are critical in crude oil trading as they indicate zones where buying pressure is significant enough to prevent further price decline. In the provided crude oil trading chart, the B1 & B2 levels serve as excellent examples of strong support zones.
Key Factors in Identifying Strong Support Levels
- Multiple Price Rejections – If the price bounces off a level multiple times, it confirms strong support.
- High Trading Volume – Increased volume at a support zone strengthens its reliability.
- Moving Average Confirmation – Support near major moving averages (like the 200 MA in the chart) is more reliable.
- Psychological Levels – Support often forms near whole numbers (e.g., $67.50, $68.00).
- Candlestick Patterns – Reversal patterns like hammer candles at support indicate strong buying pressure.
Case Study: B1 & B2 Support Levels in Crude Oil Chart
📌 B1 Support Zone:
- The price tested this level multiple times before reversing upward.
- The breakout from B1 led to a strong bullish rally.
📌 B2 Support Zone:
- Price again found strong demand at this level, confirming it as a support zone.
- The 200-day moving average aligns with B2, making it even stronger.
- Multiple bullish candlestick formations indicate buyers stepping in.
How to Trade Strong Support Levels?
✔️ Enter Buy Trades: When price tests support with bullish confirmation (e.g., hammer candle, high volume).
✔️ Set Stop-Loss: Slightly below the support level to limit risk.
✔️ Target Resistance Levels: Aim for the next key resistance as a profit target.
Additional Learning Resources:
- Support & Resistance Trading Strategy (Investopedia)
- Crude Oil Trading Insights (HiTrade Official)
By recognizing strong support levels like B1 & B2, traders can make more accurate entries and improve trade success rates. 🚀
Resistance Areas and Their Impact on Price Action
Resistance levels play a crucial role in crude oil trading as they indicate zones where selling pressure overcomes buying momentum, preventing further price increases. Understanding how resistance affects price action can help traders make informed entry and exit decisions.
What is a Resistance Area?
A resistance area is a price zone where crude oil has struggled to move higher due to strong selling pressure. When price reaches this level, traders often see a reversal or consolidation before a breakout.
Key Characteristics of a Strong Resistance Area
✅ Multiple Rejections – If price tests a level several times without breaking through, it confirms strong resistance.
✅ Increased Selling Volume – High volume near resistance signals strong bearish sentiment.
✅ Alignment with Moving Averages – Resistance near the 50-day or 200-day moving average strengthens its validity.
✅ Psychological Round Numbers – Levels like $68.50, $69.00, or $70.00 often act as resistance.
✅ Bearish Candlestick Patterns – Patterns like shooting stars or bearish engulfing candles indicate rejection at resistance.
Impact of Resistance on Price Action
📌 Price Rejection: Resistance leads to price reversals as sellers take control.
📌 Breakout Confirmation: If price breaks above resistance with volume, it can turn into a new support level.
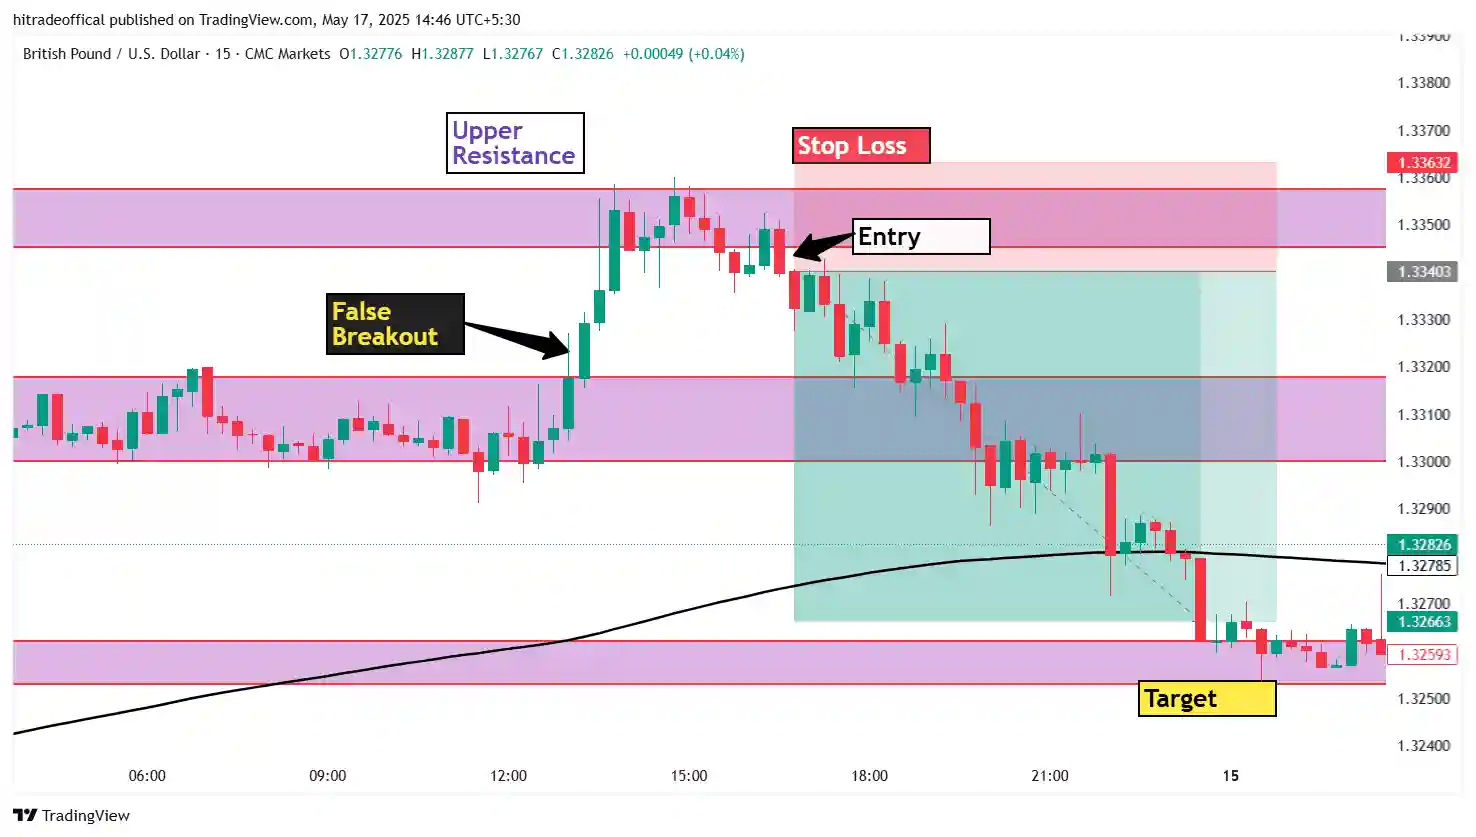
📌 False Breakouts: Sometimes, price briefly breaks resistance before falling back, trapping buyers.
Example from the Crude Oil Chart
- Resistance Zone Highlighted in the Chart: The price tested this zone multiple times before reversing.
- Failed Breakout Attempts: Indicate strong seller presence.
How to Trade Resistance Levels?
✔️ Sell at Resistance: When price struggles to break through, place a short trade with stop-loss slightly above resistance.
✔️ Trade Breakouts: If price breaks resistance with strong volume, enter a long trade after a retest as support.
✔️ Use Confirmation Indicators: Combine RSI, MACD, and Moving Averages for confirmation.
Additional Learning Resources:
- How Resistance Affects Trading Decisions (Investopedia)
- Technical Analysis in Crude Oil Trading (HiTrade Official)
By mastering resistance areas, traders can anticipate market reversals and improve their trading accuracy. 🚀
The Role of Moving Averages in Confirming Market Trends
Moving averages (MAs) are essential tools in crude oil trading, helping traders identify trends, confirm support and resistance levels, and make better entry and exit decisions. They smooth out price fluctuations and provide a clear picture of the market direction.
Types of Moving Averages Used in Crude Oil Trading
- Simple Moving Average (SMA) – The average price over a specific period (e.g., 50-day or 200-day SMA).
- Exponential Moving Average (EMA) – Gives more weight to recent prices, making it more responsive to price action (e.g., 9 EMA, 20 EMA).
How Moving Averages Confirm Market Trends
✅ Identifying Trend Direction:
- Price above the moving average → Bullish trend 📈
- Price below the moving average → Bearish trend 📉
✅ Acting as Dynamic Support & Resistance:
- 50-day & 200-day MAs often act as support in uptrends and resistance in downtrends.
- Example: In the crude oil trading chart, price reacts to the 200-day MA, confirming strong support/resistance.
✅ Detecting Trend Reversals:
- Golden Cross (50 MA crosses above 200 MA) → Bullish Signal 🔥
- Death Cross (50 MA crosses below 200 MA) → Bearish Signal ❄️
How to Use Moving Averages in Crude Oil Trading?
✔️ Trend Confirmation: Trade in the direction of the 50-day & 200-day moving averages.
✔️ Support & Resistance Levels: Enter trades when price respects MAs as support or resistance.
✔️ Breakout Trading: If price breaks above/below a moving average, it signals potential trend continuation.
Example from the Crude Oil Chart
- Price bouncing off the 200-day MA confirms it as a strong support zone.
- 50-day MA aligning with resistance strengthens the selling pressure.
Additional Learning Resources:
- Moving Averages in Technical Analysis (Investopedia)
- Crude Oil Trading Strategies (HiTrade Official)
By incorporating moving averages in trading strategies, crude oil traders can enhance their market analysis and make more confident trading decisions. 🚀
Breakout vs. Reversal: How to Trade at Key Levels
When trading crude oil, understanding the difference between a breakout and a reversal at key levels like support and resistance is crucial. These two market movements can determine whether traders should enter a trade or wait for confirmation.
What is a Breakout?
A breakout occurs when the price moves decisively above resistance or below support, often accompanied by strong volume. Breakouts signal a potential continuation of the trend.
A bullish breakout happens when the price breaks above resistance, indicating strong buying momentum. A bearish breakout occurs when the price falls below support, signaling further downside movement.
Example from the Crude Oil Chart:
A breakout above the resistance zone could lead to a price surge. If price breaks below B1 or B2 support, it could trigger a bearish trend.
What is a Reversal?
A reversal happens when the price fails to break support or resistance and changes direction. This signals a shift in trend.
A bullish reversal occurs when the price bounces from support, creating an uptrend. A bearish reversal takes place when price gets rejected at resistance and moves downward.
Example from the Crude Oil Chart:
The B1 & B2 support levels show price bouncing multiple times, confirming a bullish reversal. Price rejection at resistance levels signals a potential bearish reversal.
How to Trade Breakouts & Reversals?
Trading Breakouts:
Wait for a strong candlestick close above resistance (bullish) or below support (bearish). Confirm with volume – high volume increases breakout reliability. Use retest strategy – wait for price to retest the breakout level before entering.
Trading Reversals:
Look for candlestick patterns like hammer (bullish) or shooting star (bearish) at key levels. Use RSI divergence – if price moves lower but RSI trends higher, a bullish reversal is likely. Place stop-loss orders below support or above resistance to manage risk.
Additional Learning Resources
How to Trade Breakouts & Reversals (BabyPips)
Mastering Crude Oil Trading Strategies (HiTrade Official)
By understanding breakouts and reversals, crude oil traders can improve their timing and accuracy in executing profitable trades. 🚀
Using Volume Analysis to Strengthen Trading Decisions
Volume is one of the most powerful indicators in crude oil trading, helping traders confirm trends, detect breakouts, and identify potential reversals. Analyzing trading volume alongside price action can significantly improve decision-making.
Why is Volume Important in Trading?
Volume represents the number of contracts traded during a given period. High volume indicates strong market interest, while low volume signals weak participation. By understanding volume trends, traders can validate price movements and avoid false signals.
How Volume Confirms Breakouts
A breakout above resistance or below support is more reliable when accompanied by high volume. If price breaks resistance with strong volume, it suggests buyers are in control, increasing the likelihood of an uptrend. Conversely, a breakdown below support with heavy selling volume indicates strong bearish momentum.
Example from the Crude Oil Chart:
If crude oil price breaks above a key resistance level but volume is low, the breakout might fail. However, if the breakout happens with a surge in volume, it confirms strong buying interest.
Volume and Trend Reversals
Volume also plays a crucial role in identifying reversals. If the price is rising but volume starts to decline, it signals weakening momentum and a possible reversal. Similarly, if price drops significantly but volume increases, it may indicate strong selling pressure leading to further declines.
Example from the Crude Oil Chart:
If crude oil is testing the B1 or B2 support levels and volume spikes, it suggests strong buying interest, increasing the likelihood of a bullish reversal.
Volume-Based Trading Strategies
1. Breakout Confirmation
Traders should only enter a breakout trade if volume supports the move. Low-volume breakouts are often false signals.
2. Volume Spikes at Key Levels
A sudden increase in volume at support or resistance often indicates a shift in market sentiment, helping traders time their entries.
3. Volume Divergence
If price is making new highs but volume is decreasing, it signals weakening momentum, suggesting a potential reversal.
Additional Learning Resources
Understanding Volume in Trading (Investopedia)
Advanced Crude Oil Trading Strategies (HiTrade Official)
By incorporating volume analysis into their strategies, crude oil traders can gain deeper insights into market movements and make more confident trading decisions. 🚀
Best Strategies for Trading Crude Oil with Technical Analysis
Trading crude oil using technical analysis requires a combination of indicators, chart patterns, and price action strategies to identify profitable trade opportunities. By analyzing historical price movements and market trends, traders can make informed decisions.
1. Support and Resistance Trading
Support and resistance levels are essential in crude oil trading as they indicate key price zones where the market has historically reversed or consolidated. Traders can use these levels to enter trades with minimal risk.
- Buy at Support: Enter long positions when the price bounces off strong support levels (e.g., B1 & B2 zones in the crude oil chart).
- Sell at Resistance: Enter short positions when price struggles to break above a key resistance zone.
- Confirm with Volume: High trading volume near support or resistance strengthens the reliability of these levels.
2. Moving Averages Strategy
Moving averages help traders identify trends and potential entry points. The most commonly used moving averages in crude oil trading are the 50-day and 200-day MAs.
- Golden Cross (Bullish Signal): When the 50-day MA crosses above the 200-day MA, it signals an uptrend.
- Death Cross (Bearish Signal): When the 50-day MA crosses below the 200-day MA, it indicates a downtrend.
- Dynamic Support and Resistance: Moving averages act as dynamic levels where price often finds support or resistance.
3. Breakout Trading Strategy
Breakouts occur when price moves decisively above resistance or below support, signaling the start of a new trend.
- Bullish Breakout: Enter a trade when price breaks above resistance with strong volume confirmation.
- Bearish Breakdown: Short the market when price falls below a key support level.
- Retest Strategy: Wait for the price to retest the breakout level before entering the trade.
4. Trendline and Chart Pattern Strategy
Trendlines help traders identify the direction of the market. Common chart patterns in crude oil trading include:
- Ascending Triangle: Indicates a potential bullish breakout.
- Descending Triangle: Suggests a bearish breakdown.
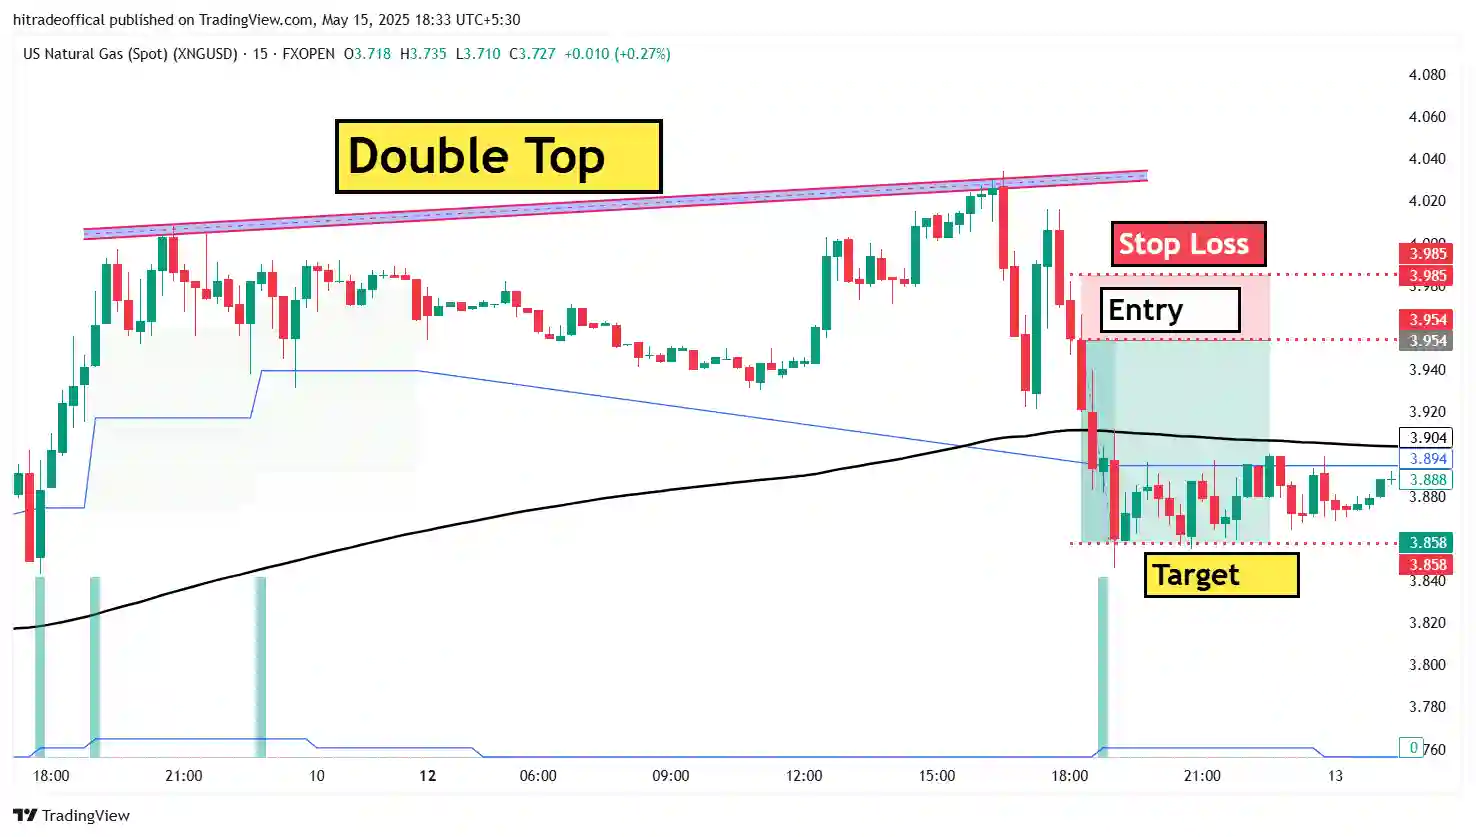
- Double Top & Double Bottom: Signals trend reversals.
5. RSI and MACD for Momentum Trading
- RSI (Relative Strength Index): If RSI is above 70, crude oil may be overbought (sell signal). If RSI is below 30, it may be oversold (buy signal).
- MACD (Moving Average Convergence Divergence): A MACD crossover above the signal line confirms bullish momentum, while a crossover below signals bearish movement.
6. Volume Analysis for Trade Confirmation
Volume plays a key role in confirming breakouts and reversals. High volume during a breakout increases its reliability, while low volume may indicate a false breakout.
7. Fibonacci Retracement Strategy
Fibonacci levels help traders identify potential retracement zones in trending markets. Common levels include 38.2%, 50%, and 61.8%, which often act as support or resistance.
8. News and Market Sentiment Analysis
Crude oil prices are influenced by global news, OPEC decisions, and economic reports. Combining technical analysis with fundamental news can help traders anticipate price movements.
Additional Learning Resources
Technical Analysis for Crude Oil Trading (Investopedia)
Mastering Crude Oil Trading Strategies (HiTrade Official)
By applying these technical analysis strategies, traders can enhance their ability to predict price movements and make well-informed trading decisions. 🚀
Conclusion: Mastering Crude Oil Trading with Technical Analysis
Successful crude oil trading requires a deep understanding of technical analysis, including support and resistance levels, moving averages, volume analysis, and key indicators like RSI and MACD. By applying strategies such as breakout trading, trendline analysis, and Fibonacci retracements, traders can improve their market timing and decision-making.
Combining technical indicators with price action and market sentiment allows traders to identify high-probability trade setups and minimize risks. Additionally, monitoring trading volume and key chart patterns ensures better confirmation of market trends and potential reversals.
To maximize success in crude oil trading, it’s crucial to practice risk management, use stop-loss orders, and continuously stay updated with market trends and economic factors. Whether you’re a beginner or an experienced trader, refining your technical analysis skills can help you navigate the volatility of crude oil markets effectively.
For more in-depth strategies and insights, visit HiTrade Official and stay ahead in the world of crude oil trading! 🚀
Top 10 FAQs on Trading Crude Oil Using Technical Analysis
1. What is the Best Technical Indicator for Crude Oil Trading?
The best technical indicators for crude oil trading include Moving Averages (50-day & 200-day), RSI, MACD, and Volume Analysis. These indicators help traders identify trends, confirm breakouts, and spot potential reversals.
2. How Do Support and Resistance Levels Affect Crude Oil Prices?
Support and resistance levels act as key price zones where crude oil tends to bounce or reverse. Traders use these levels to enter long positions at support and short positions at resistance to maximize profits.
3. What is the Difference Between a Breakout and a Reversal in Crude Oil Trading?
A breakout occurs when price moves above resistance or below support with strong momentum, indicating a trend continuation. A reversal happens when price fails to break a key level and changes direction, signaling a potential trend shift.
4. How Can Moving Averages Help in Crude Oil Trading?
Moving averages act as dynamic support and resistance levels. The Golden Cross (50 MA crossing above 200 MA) signals a bullish trend, while the Death Cross (50 MA crossing below 200 MA) indicates a bearish trend.
5. Why is Volume Important in Confirming Crude Oil Trading Signals?
Volume confirms the strength of price movements. High volume during a breakout validates the trend, while low volume can indicate a false breakout. Volume spikes at support or resistance suggest strong buying or selling pressure.
6. How Can I Use RSI to Trade Crude Oil?
The Relative Strength Index (RSI) helps traders identify overbought and oversold conditions. If RSI is above 70, crude oil may be overbought (sell signal). If RSI is below 30, it may be oversold (buy signal).
7. What is the Best Time Frame for Analyzing Crude Oil Charts?
The best time frame depends on your trading style. Day traders use shorter time frames like 5-minute or 15-minute charts, while swing traders prefer 4-hour or daily charts for better trend analysis.
8. Can Fibonacci Retracement Levels Help in Crude Oil Trading?
Yes, Fibonacci retracement levels (38.2%, 50%, 61.8%) help traders identify potential pullback zones where price may reverse or continue trending. These levels act as strong support and resistance.
9. How Do News and Economic Reports Affect Crude Oil Prices?
Crude oil prices are heavily influenced by OPEC decisions, U.S. crude oil inventory reports, global supply and demand, and geopolitical events. Combining technical analysis with fundamental news can improve trading accuracy.
10. What Are the Best Strategies for Risk Management in Crude Oil Trading?
To manage risk effectively, traders should use stop-loss orders, position sizing, and proper risk-reward ratios. A common strategy is risking no more than 2% of your trading capital per trade to protect against market volatility.
For more expert insights and trading strategies, visit HiTrade Official and stay ahead in the crude oil market! 🚀