1. Understanding the Double Top Pattern in Crude Oil Trading
A Double Top Pattern is a bearish reversal pattern that signals a potential change in trend direction from bullish to bearish. It is widely used in crude oil trading and other financial markets to identify potential selling opportunities.
Understanding the Double Top Pattern
The pattern consists of the following key elements:
- Two Peaks (Tops) – The price reaches a high, retraces slightly, and then attempts to retest the same high but fails to break above it.
- Neckline Support – A horizontal or slightly slanted support level is formed at the lowest point between the two peaks.
- Breakout Confirmation – When the price breaks below the neckline support, it confirms the pattern and indicates a potential downtrend.
2. How to Identify a Double Top Formation on the Chart
The Double Top pattern is a popular bearish reversal pattern that signals a potential trend reversal from an uptrend to a downtrend. It consists of two peaks at nearly the same resistance level, separated by a moderate price pullback. Here’s how to identify it on a chart:
- Strong Uptrend: The price moves upward, forming a higher high before experiencing resistance.
- First Peak (Top 1) – The price reaches a high point and then pulls back, finding temporary support.
- Pullback to Neckline – After hitting the first peak, the price retraces to a key support level (neckline).
- Second Peak Formation – The price bounces back from the support level but fails to break above the first peak, creating Top 2 at a similar level.
- Breakout Below the Neckline – A confirmed bearish breakout happens when the price falls below the neckline with increased trading volume, signaling a potential downtrend.
Using technical indicators like the Relative Strength Index (RSI), Moving Averages (MA), and MACD can help confirm the Double Top pattern and improve trading accuracy.
3. Key Resistance Levels in Double Top Patterns
In Double Top Patterns, identifying resistance levels is crucial for traders to confirm trend reversals and make informed trading decisions. These resistance levels indicate strong price rejection zones where selling pressure dominates.
1. Peak Resistance (Major Resistance Level)
- The two peaks in a Double Top Pattern form at nearly the same price level.
- This level acts as a strong resistance, where the price fails to break above twice.
- A breakout above this level would invalidate the pattern and could signal continued bullish momentum.
2. Psychological Resistance Levels
- Round numbers (e.g., ₹100, ₹500, ₹1,000 per barrel in crude oil) often act as psychological barriers where traders place orders.
- If the double top forms near these levels, they can reinforce resistance strength.
3. Moving Average Resistance
- The 50-day or 200-day moving average often acts as dynamic resistance when aligning with the double top peaks.
- If the price struggles to break above these moving averages, it adds confirmation to the resistance.
4. Fibonacci Retracement Resistance
- The 61.8% Fibonacci retracement level often aligns with double top formations, acting as a strong resistance level before the price reverses.
- Traders use Fibonacci tools to validate whether the second peak is forming at a key resistance level.
How to Use These Resistance Levels in Trading?
✅ Wait for Confirmation: A second rejection from the peak resistance strengthens the bearish signal.
✅ Monitor Volume: Decreasing volume at the second peak indicates weak buying pressure, supporting the reversal.
✅ Use Stop-Loss Above Resistance: If you enter a short trade, placing a stop-loss just above the resistance ensures risk management.
Would you like an example using a crude oil chart analysis? 📉🔥
4. Why the Double Top is a Bearish Reversal Signal?
The Double Top Pattern is considered a bearish reversal signal because it indicates a shift from a bullish trend to a potential downtrend. Here’s why:
1. Failure to Break Resistance
- In an uptrend, prices make higher highs and higher lows.
- A Double Top occurs when the price attempts to break a previous high but fails at the same resistance level twice.
- This failure signals weak buying pressure and suggests that sellers are gaining control.
2. Formation of a Neckline (Support Breakdown)
- After forming two peaks, the price pulls back and creates a support level known as the neckline.
- When the price breaks below the neckline, it confirms the bearish reversal.
- This breakdown indicates that buyers are unable to hold support, leading to increased selling pressure.
3. Shift in Market Sentiment
- The inability to break higher discourages buyers and attracts more sellers.
- Traders who were previously bullish start closing long positions, while new short positions enter the market.
- This shift leads to a momentum change, reinforcing the bearish trend.
4. Volume Confirmation
- Volume often decreases during the second peak, indicating weak buying interest.
- When the neckline breaks, volume spikes, confirming strong selling momentum and a potential trend reversal.
5. Measured Move (Price Target)
- The expected downward move after a double top is often equal to the height of the pattern (distance from peak to neckline).
- This helps traders estimate the target price for their short positions.
Example in Crude Oil Trading
- Price rises to ₹7,500 per barrel, then retraces.
- Price attempts to rise again to ₹7,500 but fails, forming a double top.
- Neckline forms at ₹7,200 – if the price breaks below ₹7,200, it signals a bearish reversal.
- Projected target: ₹6,900 (equal to the pattern height subtracted from the neckline).
Conclusion
The Double Top Pattern is a classic bearish reversal indicator, showing that buyers are losing strength and sellers are taking control. To trade effectively, use volume analysis, moving averages, and support levels for confirmation.
Would you like a chart example for better visualization? 📉🔥
5. Trading Strategies for Double Top Pattern in WTI Crude Oil
The Double Top Pattern is a strong bearish reversal signal in WTI crude oil trading. Traders use various strategies to capitalize on this formation. Here’s how you can effectively trade it:
1. Identifying the Double Top in WTI Crude Oil
✅ Look for two peaks at a similar price level, indicating strong resistance.
✅ Confirm a neckline support at the lowest point between the peaks.
✅ Check volume patterns – lower volume at the second peak and increased volume on the neckline break confirms the pattern.
2. Entry Strategies
🔹 Standard Breakout Trade
- Entry: Enter a short position when the price breaks below the neckline with strong volume.
- Confirmation: Look for a retest of the neckline as resistance after the breakdown.
- Stop-Loss: Place a stop-loss above the second peak to limit risk.
- Target Price: Measure the height of the pattern and subtract it from the neckline.
📌 Example in WTI Crude Oil:
- Double top formed at $85 per barrel, with a neckline at $80.
- Breakdown below $80 signals a short trade.
- Price target = $80 – ($85 – $80) = $75 per barrel.
🔹 Aggressive Early Entry Trade
- Entry: Short at the second peak if it shows rejection (e.g., bearish candlestick patterns like a shooting star or engulfing candle).
- Confirmation: Look for RSI divergence or weak volume at the second top.
- Stop-Loss: A tight stop just above the peak reduces risk.
- Target: Same as the standard method (neckline break confirmation preferred).
✅ Pros: Higher reward potential.
⚠ Cons: Higher risk if the pattern fails.
🔹 Retest Confirmation Trade
- Entry: Wait for the price to break the neckline and retest it as resistance before entering a short.
- Confirmation: Bearish candlestick formation at the retest (e.g., Doji, Engulfing).
- Stop-Loss: Above the neckline to avoid false breakouts.
📌 Why it Works?
- Prevents false breakouts.
- Confirms resistance is holding.
3. Risk Management & Confirmation Tools
🔹 Stop-Loss Placement:
- Standard trade: Above the second peak.
- Aggressive entry: Above the first peak.
- Retest confirmation: Slightly above the neckline.
🔹 Confirmation Indicators:
- RSI Divergence: If RSI fails to make a new high while price forms a double top, it strengthens the bearish case.
- Volume Analysis: Lower volume on the second peak, higher on neckline break.
- Moving Averages: If the price breaks below the 50-day or 200-day MA, it confirms bearish momentum.
6. Risk Management Tips for Double Top Breakdown Trades
Trading a Double Top Breakdown can be highly profitable, but it also carries risks. Here are some risk management strategies to protect your capital and improve trading success:
1. Set a Proper Stop-Loss ✅
A stop-loss prevents excessive losses if the trade goes against you.
📌 Where to Place Stop-Loss?
- Conservative Approach: Above the second peak (strongest protection).
- Moderate Approach: Just above the neckline if the price retests it as resistance.
- Aggressive Approach: Slightly above the breakdown candle (higher risk).
2. Use Proper Position Sizing 📏
Risk only 1-2% of your total trading capital on a single trade.
💡 Example: If you have ₹1,00,000, risk ₹1,000-₹2,000 per trade.
Formula for Position Size: Lot Size=Risk AmountEntry Price−Stop-Loss Price\text{Lot Size} = \frac{\text{Risk Amount}}{\text{Entry Price} – \text{Stop-Loss Price}}Lot Size=Entry Price−Stop-Loss PriceRisk Amount
3. Confirm the Breakdown Before Entering 📉
✅ Wait for a clear break below the neckline with strong volume confirmation.
✅ Avoid entering too early—false breakouts can trap traders.
✅ Consider waiting for a retest of the neckline as resistance before shorting.
4. Set a Realistic Profit Target 🎯
Use the Measured Move Method:
- Target = Height of the Double Top subtracted from the neckline.
- Example: If the peak is ₹7500 and neckline is ₹7200, the height is ₹300.
- Target = ₹7200 – ₹300 = ₹6900.
🔹 Consider using partial profit booking at key levels (e.g., 50% at ₹7000 and 50% at ₹6900).
5. Monitor Market Conditions & News 📰
⚠ Crude Oil prices are volatile!
- Watch for economic data like OPEC reports, supply-demand trends, and geopolitical events.
- Avoid trading near high-impact news releases (like crude oil inventory reports).
6. Use a Trailing Stop-Loss to Protect Profits 📊
Once the trade moves in your favor, adjust the stop-loss:
✅ Move it to breakeven (entry price) when the trade is profitable.
✅ Trail the stop above lower highs in a downtrend to lock in gains.
7. Avoid Overleveraging & Emotional Trading 🚨
❌ Don’t use excessive leverage – crude oil is already volatile.
❌ Stick to your trading plan – avoid revenge trading after a loss.
❌ Control FOMO – don’t chase entries without proper confirmation.
Final Thoughts
✅ Stick to your stop-loss – don’t widen it.
✅ Wait for confirmation – avoid impulsive trades.
✅ Take profits strategically – don’t hold forever.
7. Best Indicators to Confirm a Double Top in Forex and Commodity Markets
A Double Top Pattern is a strong bearish reversal signal, but using technical indicators can improve accuracy and reduce false breakouts. Here are the best indicators to confirm a double top in Forex and Commodity markets (like Crude Oil, Gold, Silver, etc.):
1. Volume Indicator 📊 (Essential for Confirmation)
✅ Why Use It?
- Volume decreases at the second peak, indicating weak buying pressure.
- A volume spike on neckline breakdown confirms strong selling momentum.
🔹 Trading Strategy:
- Look for low volume on the second top and high volume on the breakdown to confirm trend reversal.
2. Relative Strength Index (RSI) 📉 (Momentum Confirmation)
✅ Why Use It?
- RSI Divergence is a strong bearish confirmation:
- If price forms a double top but RSI makes a lower high, it signals weak bullish momentum.
- RSI falling below 50 after the breakdown strengthens the bearish case.
🔹 Trading Strategy:
- Sell Confirmation: When RSI shows bearish divergence and breaks below 50.
- Stop-Loss Adjustment: If RSI moves back above 50, reconsider the short trade.
3. Moving Averages (Trend Confirmation) 📈
✅ Why Use It?
- The 50-day and 200-day Moving Averages act as dynamic resistance.
- If the price fails to break the 200-day MA at the second peak, it confirms strong resistance.
- The crossover of short-term and long-term moving averages signals trend change.
🔹 Trading Strategy:
- Bearish Confirmation: If the price breaks below the 50-day MA after the neckline breakdown.
- Stronger Sell Signal: If the 50-day MA crosses below the 200-day MA (Death Cross).
4. MACD (Trend & Momentum Confirmation) 🔄
✅ Why Use It?
- If MACD shows a bearish crossover (MACD line crosses below the signal line), it confirms trend weakness.
- MACD Histogram turning negative strengthens bearish momentum.
🔹 Trading Strategy:
- Look for a bearish MACD crossover at the second peak.
- If the MACD crosses below zero, it confirms the downtrend.
5. Fibonacci Retracement (Resistance & Target Levels) 🔢
✅ Why Use It?
- The 61.8% Fibonacci retracement level often acts as strong resistance.
- If the second top forms near a Fibonacci level, it adds confirmation to the pattern.
🔹 Trading Strategy:
- If the second peak is at the 61.8% or 78.6% retracement level, it strengthens resistance.
- If price breaks the neckline and falls toward the 127.2% or 161.8% extension, use it as a profit target.
Final Thoughts
💡 Best Indicator Combination for Strong Confirmation:
✅ Volume (low at the second top, high on breakdown)
✅ RSI Divergence (lower high while price makes a double top)
✅ MACD Bearish Crossover & Histogram below zero
✅ Moving Average Breakdown (below 50-day MA)
8. How to Set Stop Loss and Take Profit in a Double Top Trade
The Double Top Pattern is a strong bearish reversal signal, but proper stop-loss and take-profit placement is crucial for effective risk management. Here’s how to do it right:
1. Stop-Loss Placement 📍
A stop-loss protects against unexpected price movements and prevents large losses.
🔹 Conservative Stop-Loss (Low Risk) 🛑
- Place stop-loss above the second peak to allow for small fluctuations.
- This is the most reliable method but requires a slightly larger stop-loss.
📌 Example:
- Double top peaks at ₹7,500 and neckline at ₹7,200.
- Stop-loss above ₹7,500 (e.g., ₹7,550).
✅ Pros: Low chance of premature stop-out.
❌ Cons: Higher risk-to-reward ratio.
🔹 Moderate Stop-Loss (Balanced Risk) ⚖
- Place stop-loss slightly above the neckline if the price retests and fails.
- Used when traders wait for a breakout and retest of neckline.
📌 Example:
- If the neckline is at ₹7,200, set stop-loss at ₹7,250 after retest.
✅ Pros: Smaller risk, good for aggressive traders.
❌ Cons: Can be hit by fake breakouts.
🔹 Aggressive Stop-Loss (High Risk, High Reward) 🎯
- Place stop-loss just above the breakout candle below the neckline.
- Used in high-momentum breakdown trades with strong volume confirmation.
📌 Example:
- If the price breaks ₹7,200 and falls to ₹7,180, set stop-loss at ₹7,220.
✅ Pros: Higher risk-to-reward ratio.
❌ Cons: More prone to false breakouts.
2. Take-Profit Placement 🎯
A take-profit ensures disciplined exits at profitable levels.
🔹 Measured Move Method (Standard Target)
- The profit target = Height of the double top pattern subtracted from the neckline.
📌 Example:
- Double top peaks at ₹7,500, neckline at ₹7,200.
- Height = ₹7,500 – ₹7,200 = ₹300.
- Take-profit target = ₹7,200 – ₹300 = ₹6,900.
✅ Pros: Logical target based on pattern structure.
❌ Cons: Market may reverse before hitting the target.
🔹 Fibonacci Extension (Advanced Targeting) 📈
- Use 127.2% or 161.8% Fibonacci extensions for extended targets.
- Best used when the market has strong momentum after the breakdown.
📌 Example:
- If the neckline is at ₹7,200, 127.2% target = ₹6,850, 161.8% target = ₹6,700.
✅ Pros: Captures extended moves in strong trends.
❌ Cons: Market may reverse before reaching the extended target.
🔹 Partial Profit Booking Strategy 💰
- Take 50% profit at first target and let the rest run using a trailing stop-loss.
- Move stop-loss to breakeven after price moves in favor.
📌 Example:
- Target 1: ₹6,900 (50% exit).
- Target 2: ₹6,750 (remaining position).
- Adjust stop-loss to ₹7,100 after hitting first target.
✅ Pros: Locks in profits while maximizing gains.
❌ Cons: Can stop out early if price retraces.
Final Thoughts
🔹 Best Stop-Loss Choice: Above the second peak for strong risk management.
🔹 Best Take-Profit Choice: Use measured move target or Fibonacci extensions.
🔹 Advanced Tip: Use trailing stop-loss to secure profits in strong moves.
9. Common Mistakes Traders Make While Trading the Double Top Pattern
The Double Top Pattern is a strong bearish reversal signal, but many traders make critical mistakes that lead to false breakouts and losing trades. Here are the most common mistakes and how to avoid them:
1. Entering Too Early Before Confirmation ⏳
🔴 Mistake:
- Traders often short too early at the second peak without waiting for a neckline breakout.
- This can lead to a false breakdown, where the price bounces back up.
✅ Solution:
- Wait for a clear neckline breakdown with strong volume before entering a short trade.
- A retest of the neckline after the breakdown increases trade accuracy.
📌 Example:
- If Crude Oil forms a double top at ₹7,500 and the neckline is at ₹7,200, enter only when price closes below ₹7,200 with high volume.
2. Ignoring Volume Confirmation 📊
🔴 Mistake:
- A double top is not valid unless volume confirms the breakdown.
- Many traders ignore the low volume at the second peak or low volume on the breakdown, which increases the chance of a false move.
✅ Solution:
- The second peak should have lower volume than the first, showing weak buying strength.
- The breakdown should happen with a volume surge, confirming strong selling pressure.
📌 Example:
- If price breaks below ₹7,200 but volume is low, wait for confirmation before shorting.
3. Placing Stop-Loss Too Tight or Too Loose 🎯
🔴 Mistake:
- Stop-loss too tight: Placing it just above the neckline can lead to whipsaws (fake breakouts).
- Stop-loss too loose: Placing it too far (above the first peak) increases risk and losses.
✅ Solution:
- Ideal stop-loss is slightly above the second peak or just above a breakout retest for better risk management.
📌 Example:
- If double top peaks at ₹7,500, set stop-loss at ₹7,550 instead of too close (₹7,220) or too far (₹7,700).
4. Misidentifying a Double Top Pattern ❌
🔴 Mistake:
- Sometimes, what looks like a double top is just a normal pullback in an uptrend.
- Entering shorts in a strong bullish trend can lead to unnecessary losses.
✅ Solution:
- Confirm with trend indicators (Moving Averages, MACD, RSI Divergence) before assuming a reversal.
- The second top should form near strong resistance, not just random price movement.
📌 Example:
- If WTI Crude Oil is in a strong uptrend, don’t assume a double top unless key support breaks.
5. Ignoring Market Conditions & News Events 🌍
🔴 Mistake:
- Entering a double top trade without considering news events (OPEC meetings, inflation data, oil supply reports, etc.).
- Sudden news can trigger spikes that invalidate technical patterns.
✅ Solution:
- Always check for upcoming news events before entering a trade.
- Trade with confirmation, avoiding entries near high-impact news releases.
📌 Example:
- If OPEC announces a production cut, crude oil prices might spike up, invalidating a double top breakdown.
6. Failing to Use Take-Profit & Risk Management 💰
🔴 Mistake:
- Holding the trade too long without booking profits.
- Not using a trailing stop-loss, leading to missed profits if the trend reverses.
✅ Solution:
- Use the measured move method to set a realistic take-profit target.
- Secure partial profits at key levels using Fibonacci extensions.
📌 Example:
- If the neckline is ₹7,200, and the height of the pattern is ₹300, set a target at ₹6,900.
- Book partial profits and use a trailing stop-loss to maximize gains.
Final Thoughts 💡
✅ Wait for confirmation before entering a double top trade.
✅ Use volume analysis to avoid false breakouts.
✅ Set realistic stop-loss and take-profit levels for better risk management.
✅ Check market conditions before trading the pattern.
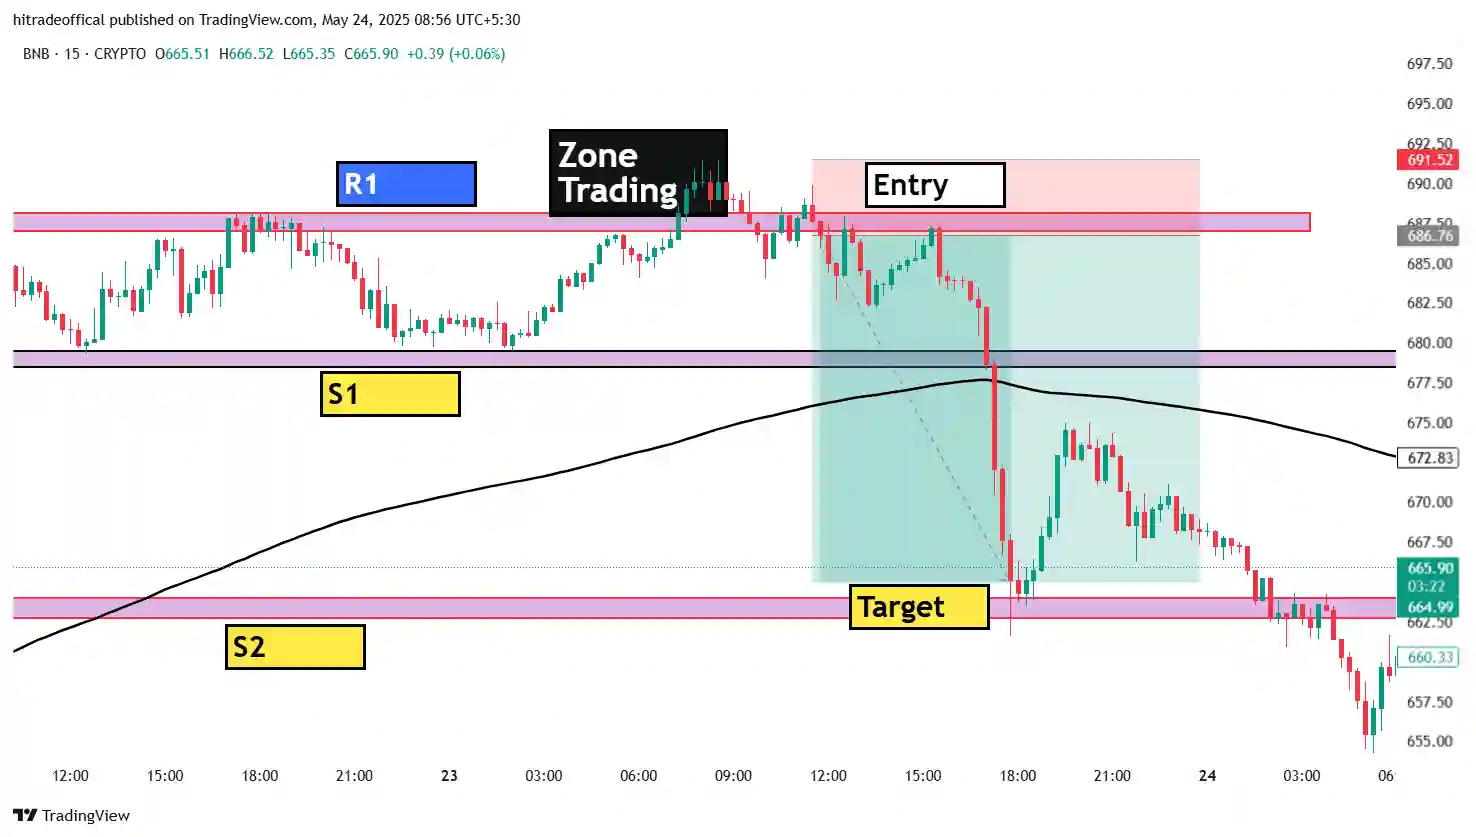
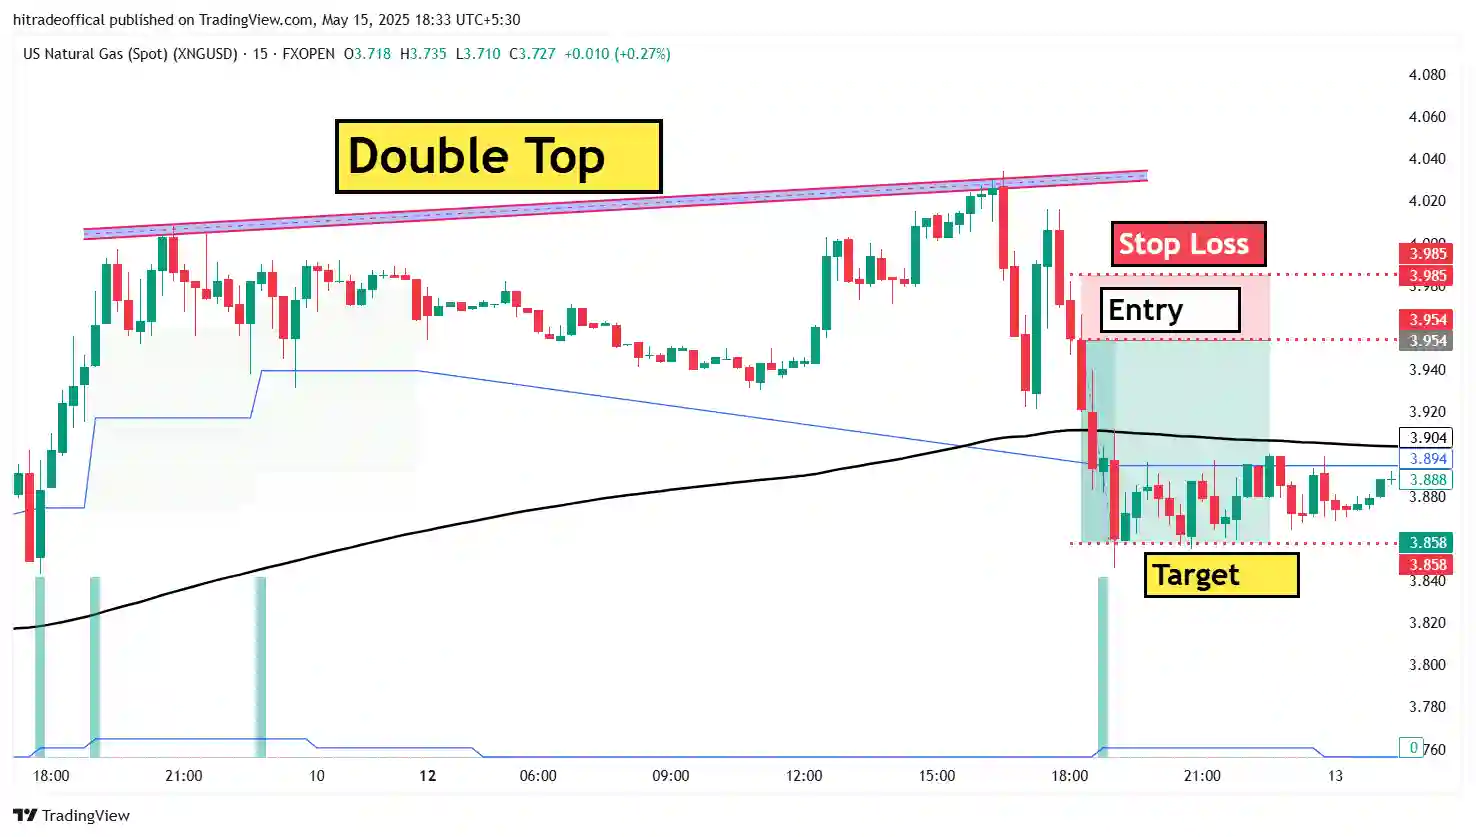
This is the image of same chart with point :-
What is the Entry Point in a Double Top Pattern?
The Entry Point is the price level where traders initiate a sell (short) position after confirming the Double Top pattern. This is a critical level that signals the beginning of a potential downtrend.
How to Identify the Entry Point?
- Break Below the Neckline:
- The entry point is usually set when the price breaks below the neckline after forming two peaks (Top 1 and Top 2).
- Wait for Confirmation:
- Traders look for a strong bearish candle or an increase in volume to confirm the breakdown before entering a trade.
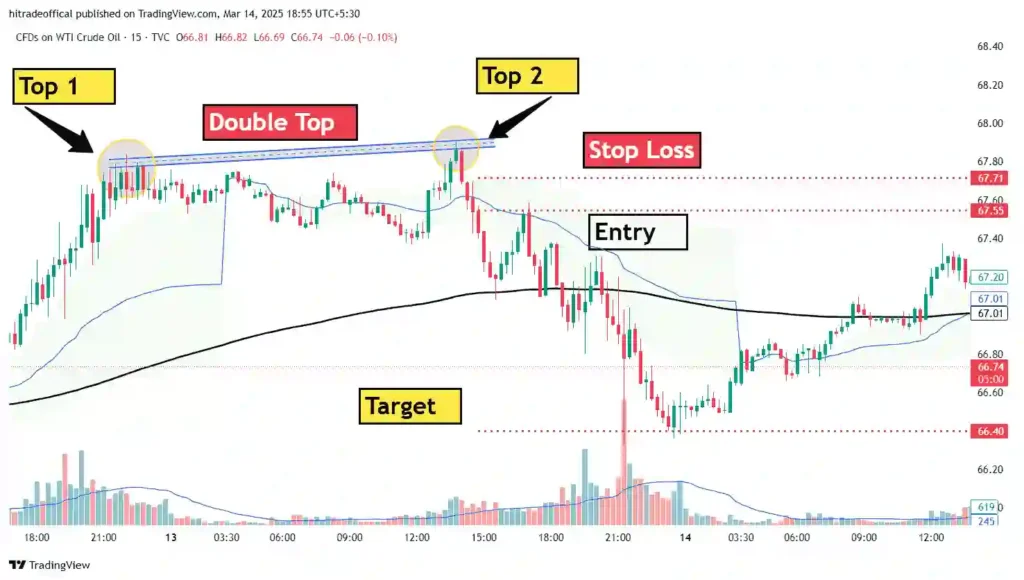
Example from the Image:
- Neckline is around 67.20
- Entry is set slightly below the neckline, around 67.10 – 67.15, to confirm the breakdown.
Entering at this point helps traders capitalize on the trend reversal while minimizing the risk of false breakouts. 🚀📉
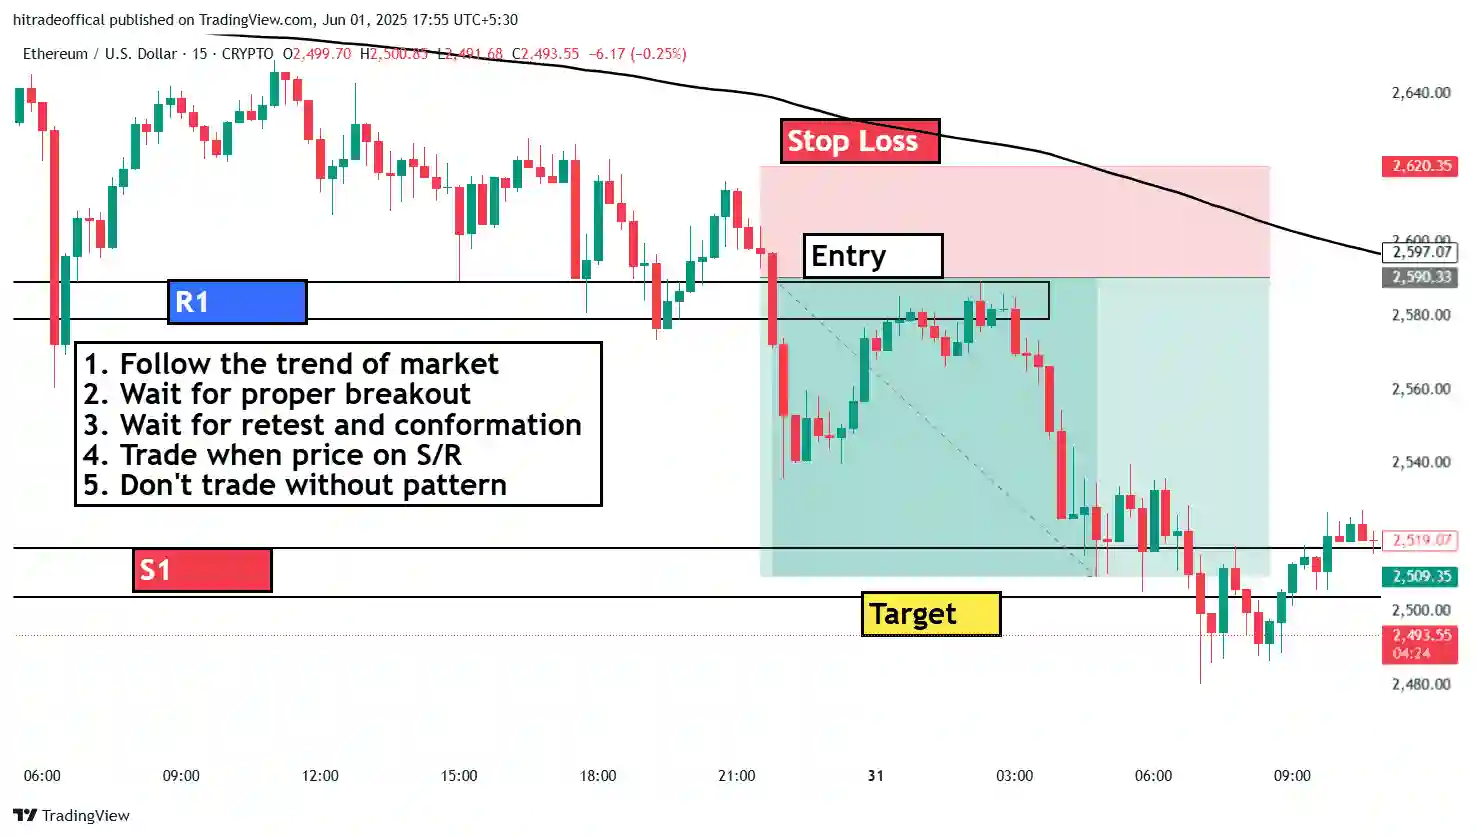
What is the Stop Loss Point in a Double Top Pattern?
The Stop Loss Point is the price level where traders exit their position if the trade goes against them. It helps in risk management by preventing excessive losses in case the Double Top pattern fails.
How to Set the Stop Loss in a Double Top Pattern?
- Above the Second Peak (Top 2):
- Since the Double Top pattern acts as resistance, placing a stop loss just above Top 2 ensures that if the price breaks above it, the pattern is invalidated.
- Consider a Buffer Zone:
- Instead of placing it exactly at the peak, traders set it slightly higher to avoid getting stopped out due to market noise.
Example from the Image:
- Top 2 is around 67.80
- Stop loss is set slightly above at 67.85 – 67.90 to avoid premature exits.
This ensures that traders cut their losses early if the pattern does not play out as expected. 🚀📉
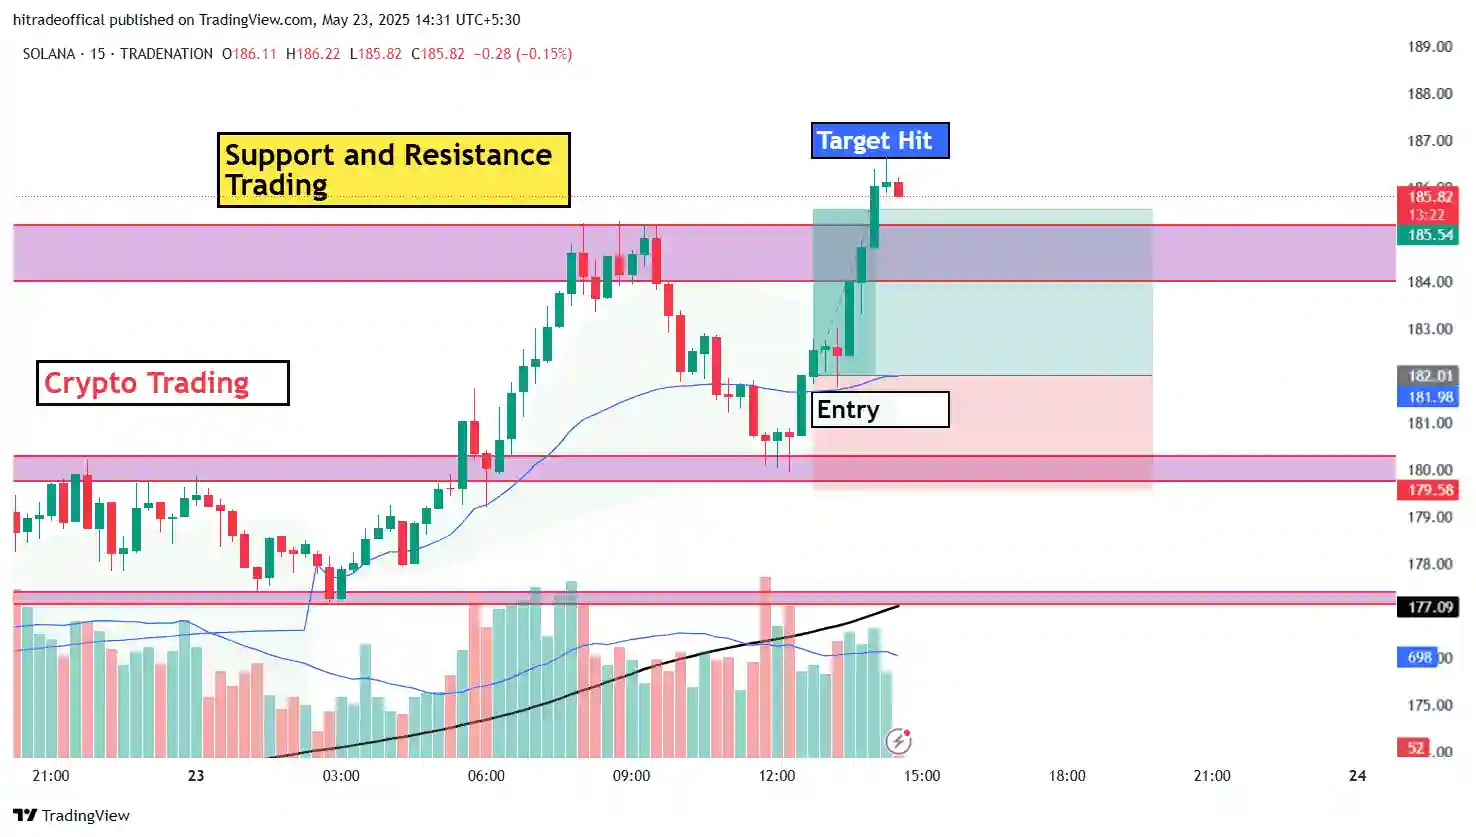
What is the Target Point in a Double Top Pattern?
The Target Point in a Double Top pattern is the expected price level where traders anticipate the price will reach after a confirmed breakdown. It is calculated based on the height of the pattern.
How to Calculate the Target Point?
- Measure the height of the pattern:
- Height = Distance from the highest peak (Top 1 & Top 2) to the neckline.
- Project the same distance downward from the neckline after a breakout.
- Target Price = Neckline – Height of the pattern
Example from the Image:
- The Double Top peaks around 67.80
- The neckline is around 67.20
- The height of the pattern = 67.80 – 67.20 = 0.60 points
- Projecting this downward, the target point would be 67.20 – 0.60 = 66.60
This method helps traders set profit targets while managing risk effectively. 📉🚀
Q&A on Double Top Pattern in Crude Oil Trading
Q1: What is a Double Top pattern in trading?
A: A Double Top pattern is a bearish reversal pattern that forms after an uptrend. It consists of two peaks (Top 1 and Top 2) at a similar resistance level, followed by a breakdown below the neckline, signaling a potential downtrend.
Q2: How does the Double Top pattern indicate a trend reversal?
A: The pattern shows that buyers failed to push the price above a key resistance level twice. When the price breaks below the neckline with strong volume, it confirms that selling pressure is increasing, leading to a bearish reversal.
Q3: What is the significance of the “Entry” level in the image?
A: The entry point is where traders open a sell position after the price breaks below the neckline. This confirms the Double Top pattern and suggests a potential downtrend.
Q4: Where should traders place a Stop Loss in a Double Top setup?
A: The Stop Loss is usually placed above the second peak (Top 2) to protect against false breakouts. In the image, the stop loss is set slightly above the resistance level to minimize risk.
Q5: How is the target price calculated in a Double Top pattern?
A: The target price is determined by measuring the height of the Double Top pattern (distance from the peaks to the neckline) and projecting that distance downward from the breakout point.
Q6: What indicators can help confirm a Double Top pattern?
A: Technical indicators such as:
- Relative Strength Index (RSI) – Overbought conditions strengthen the bearish case.
- MACD Crossover – A bearish MACD crossover confirms selling momentum.
- Volume Analysis – Increased volume during the breakdown adds validity to the pattern.
Q7: Can a Double Top pattern fail?
A: Yes, sometimes the pattern fails if the price does not break the neckline and instead moves higher, invalidating the bearish setup. This is why traders use stop-loss orders to manage risk.
Q8: How can traders use the Double Top pattern in crude oil trading?
A: Traders can use it to:
- Identify key resistance levels for short-selling opportunities.
- Set precise entry, stop-loss, and target levels for risk management.
- Confirm the pattern with indicators to increase trading accuracy.