Introduction
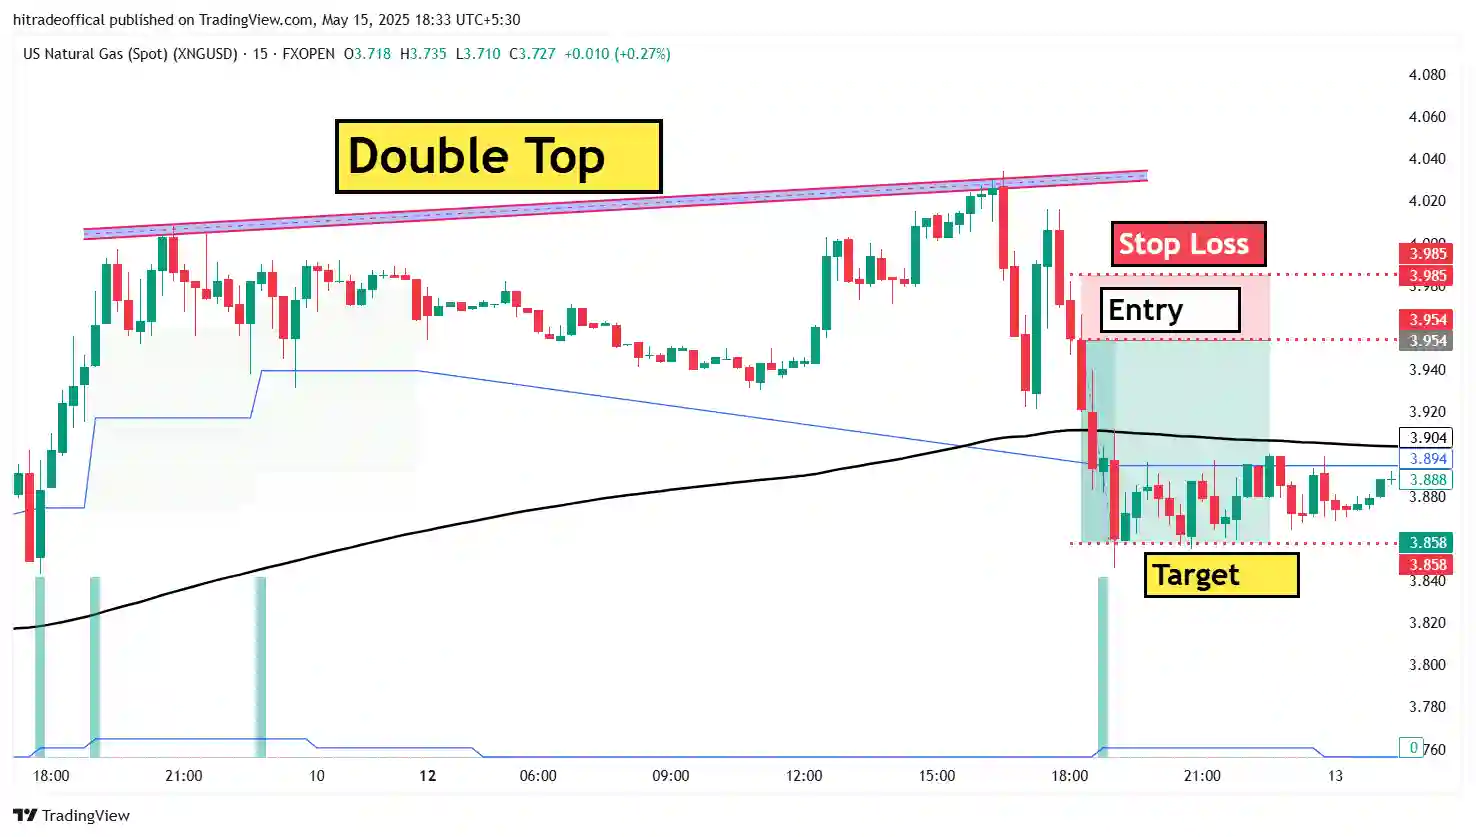
The Double Top Pattern is one of the most reliable reversal patterns in technical analysis, widely used by traders to predict potential bearish reversals in the market. This pattern forms after an asset experiences two peaks at nearly the same level, followed by a price decline. In this article, we will explore the double top pattern, its significance, how to trade it, and strategies to maximize profits while minimizing risks.
What is a Double Top Pattern?
A double top pattern is a bearish reversal chart pattern that appears after an uptrend. It consists of two distinct peaks at approximately the same price level, with a trough in between. When the price breaks below the support level (neckline), it signals a potential downward trend.
Key Characteristics of a Double Top Pattern:
- Two Peaks: The asset’s price reaches a high point twice, forming two tops at nearly the same level.
- Trough Between Peaks: A dip in price separates the two peaks.
- Neckline Support: The horizontal or slightly slanted support level at the trough.
- Breakout Confirmation: A breakdown below the neckline confirms the pattern, indicating a potential bearish move.
How to Identify a Double Top Pattern?
To successfully identify a double top pattern, follow these steps:
Step 1: Look for Two Peaks
The first step in recognizing a double top pattern is spotting two nearly equal highs in price movements. These peaks should have a resistance level that prevents the price from going higher.
Step 2: Identify the Neckline
The neckline is the support level formed at the lowest point between the two peaks. A break below this level confirms the pattern.
Step 3: Confirm the Breakout
A valid double top pattern is confirmed when the price breaks below the neckline with increased volume. Traders wait for a clear breakdown before entering a short position.
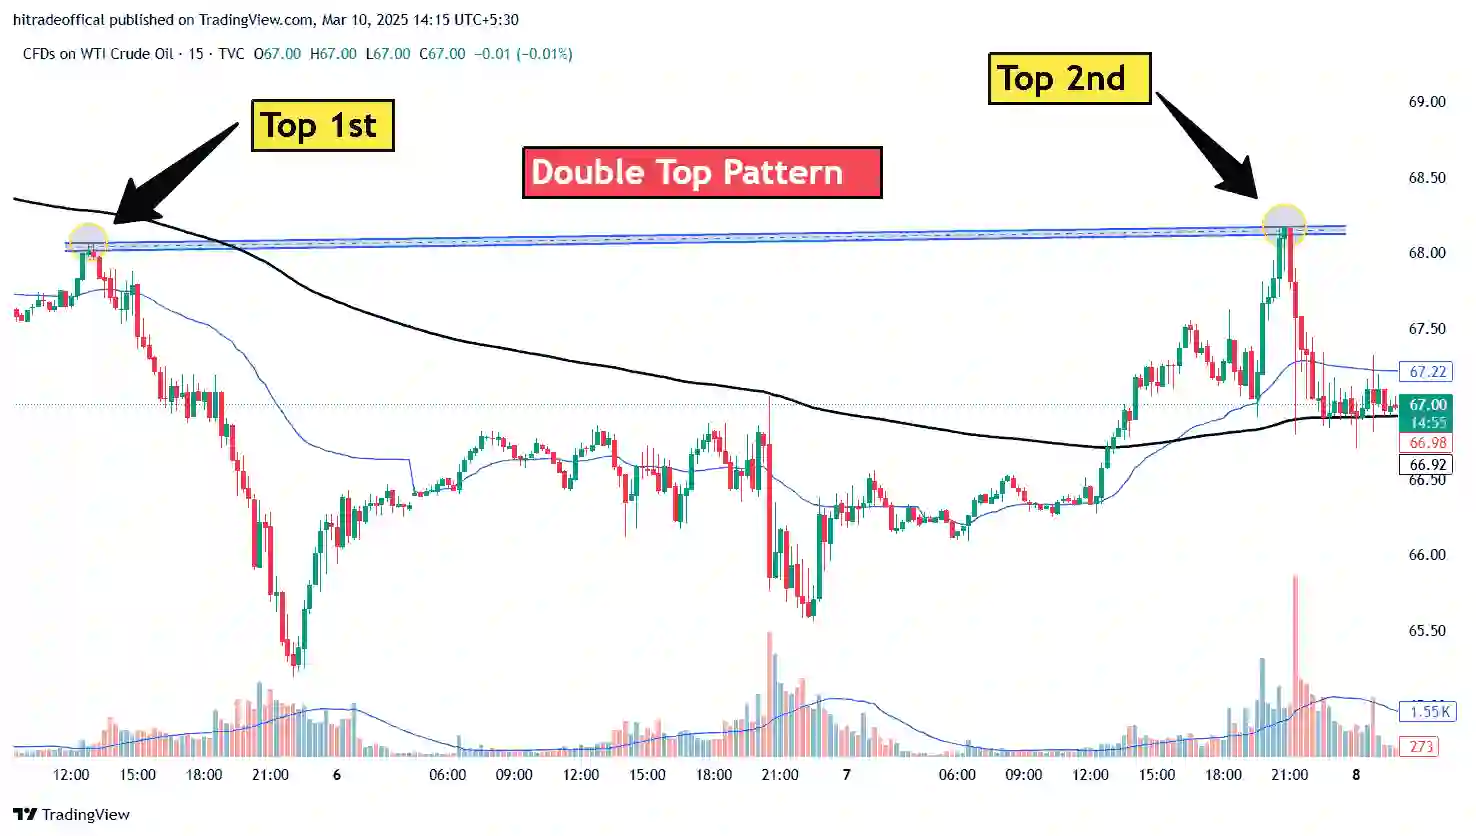
Understanding the Double Top Pattern in the Provided Image
In the given WTI Crude Oil chart, we can see a double top pattern forming:
- The first top is marked as “Top 1st,” where the price initially reaches resistance and drops.
- The second top, labeled “Top 2nd,” is at a similar price level, but the price fails to break higher.
- A blue horizontal resistance zone shows that the price is struggling to move above this area.
- Once the price starts falling, traders anticipate a breakdown below the support level, indicating a bearish trend.
Why is the Double Top Pattern Important in Trading?
1. Reliable Reversal Signal
The double top pattern is widely trusted among traders because it signals a potential shift from a bullish to a bearish trend.
2. Helps in Risk Management
Traders can place stop-loss orders above the second peak to minimize losses in case of false breakouts.
3. Easy to Identify
Unlike some complex patterns, the double top is relatively easy to spot and trade, making it suitable for beginners.
How to Trade a Double Top Pattern?
1. Entry Strategy:
- Enter a short position when the price breaks below the neckline.
- Confirm the breakout with increased volume before entering a trade.
2. Stop-Loss Placement:
- Place a stop-loss above the second peak to limit losses.
3. Profit Target:
- Measure the distance between the peaks and the neckline.
- Project this distance downward from the breakout point to set a take-profit level.
Common Mistakes While Trading the Double Top Pattern
1. Entering Too Early
- Many traders enter short positions before the neckline breaks, leading to premature trades.
2. Ignoring Volume Confirmation
- A true breakout should be accompanied by high trading volume for validation.
3. Failing to Set a Stop-Loss
- Without a stop-loss, traders expose themselves to unnecessary risks.
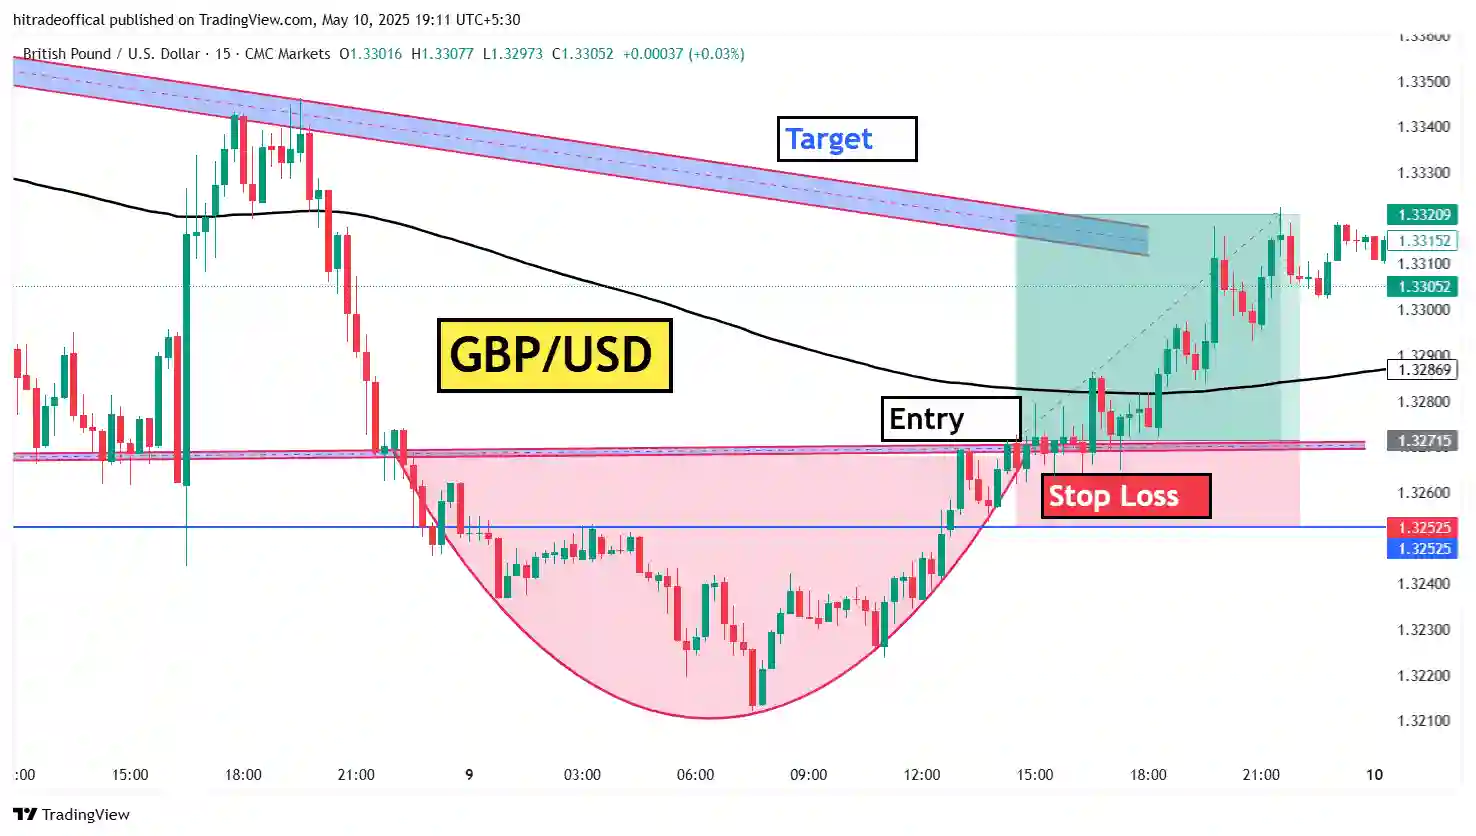
Double Top vs. Double Bottom
The double top and double bottom patterns are opposites:
- Double Top → Signals a bearish reversal.
- Double Bottom → Signals a bullish reversal.
Conclusion
The double top pattern is a powerful tool for traders looking to capitalize on trend reversals. By identifying two peaks, neckline support, and volume confirmation, traders can make informed decisions and optimize their trading strategies. Whether you’re trading stocks, forex, or commodities, mastering this pattern can significantly improve your technical analysis skills.
Start using the double top pattern in your trading strategy today and stay ahead in the market!