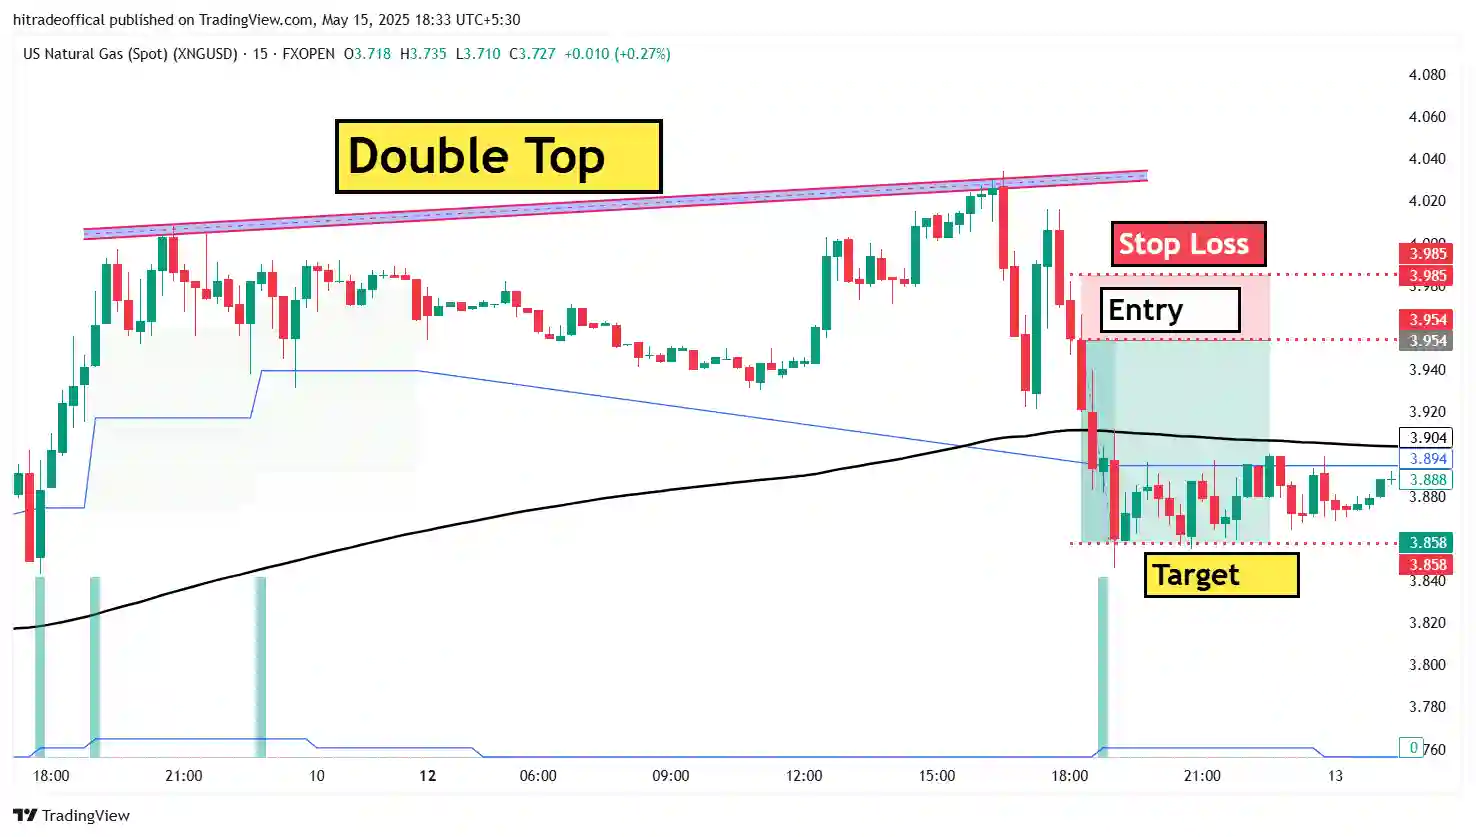
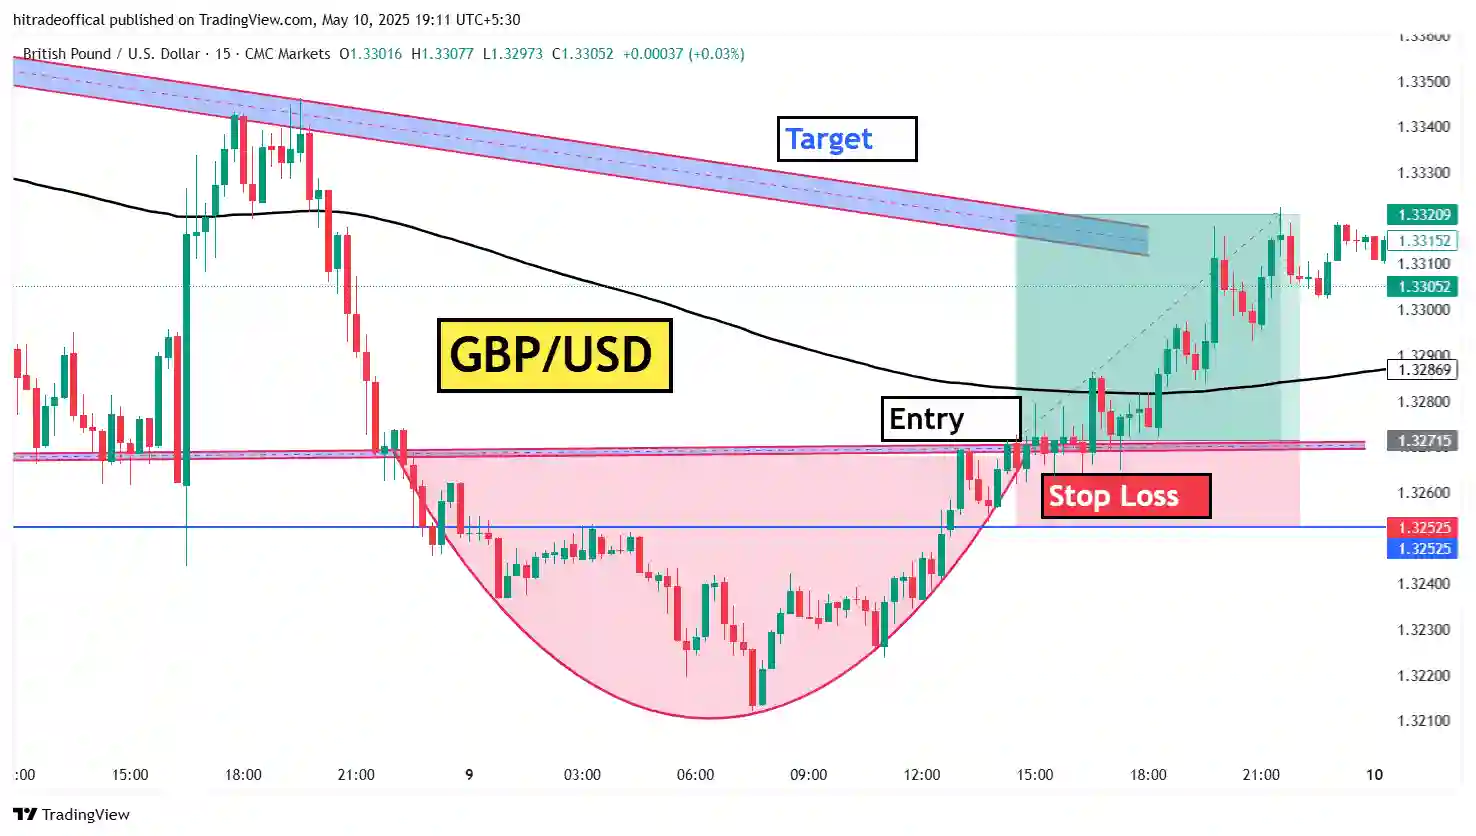
About this image :-
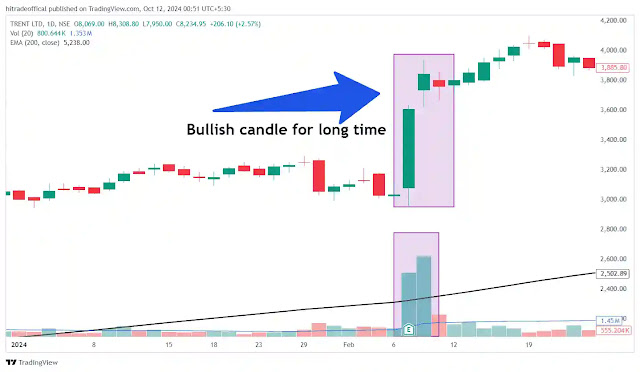
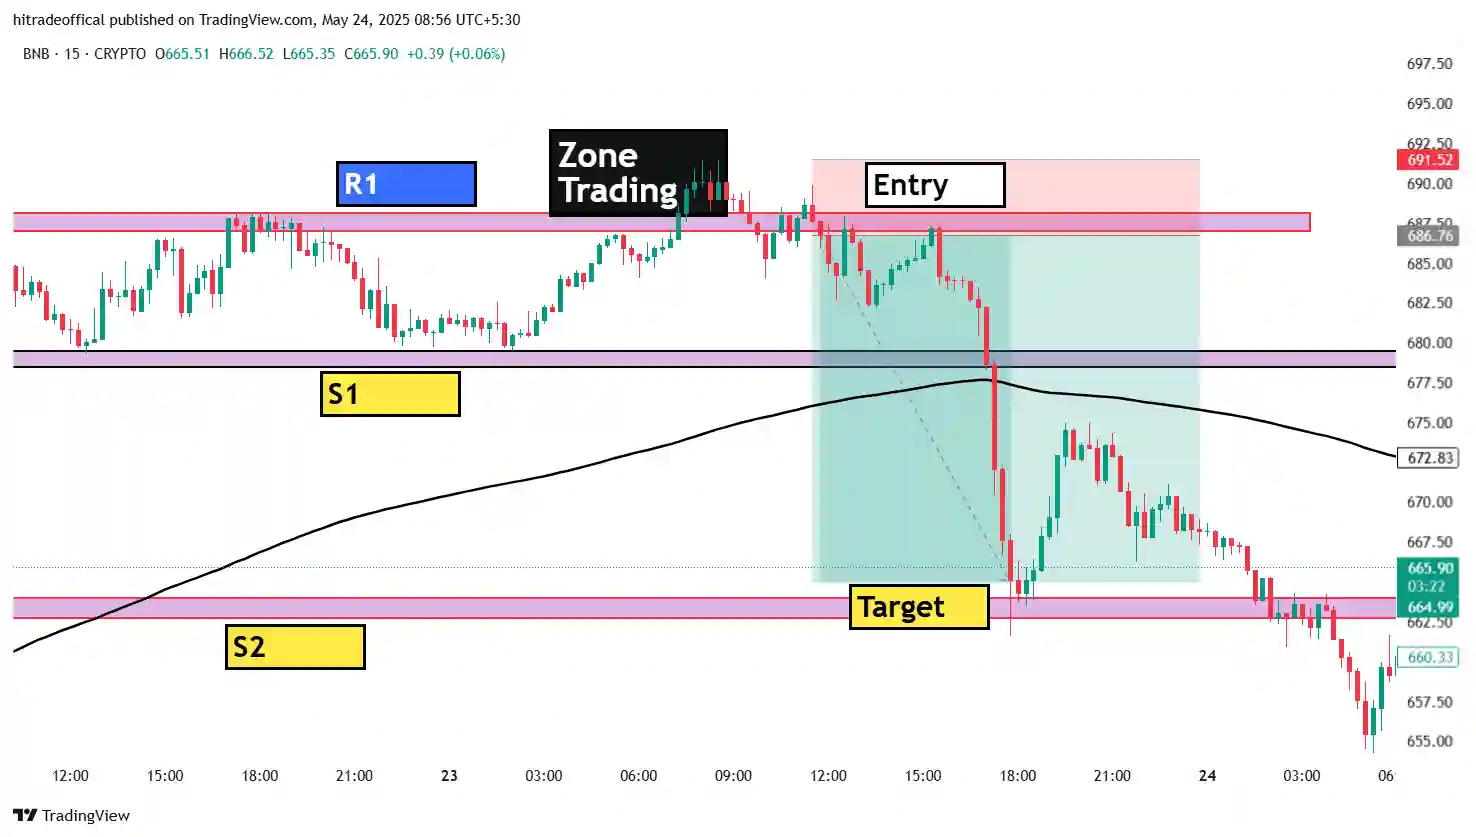
In this image you can see that a candle is form in this image we mark using rectangular drawing and when it is form than we can make good profit using this candle. Welcome to this post now keep learning and careful learning.
What is bullish candle :-
The bullish candle is simply meaning by a candle when form in chart and than price increase that is called bullish candle. In this chart you can see a bullish candle is form than price will be increase. So we need to focus on bullish candle.
How to choose bullish candle :-
There are lots of option for choosing bullish candle but if you want to choose bullish candle than you can learn price action and chart pattern otherwise this concept is difficult for choosing bullish candle and you can also choose on the basis of candle strength. This is the way using you can choose bullish candle.
Problems when we are choosing stocks for long time investment :-
This point is very simple when we are thinking and writing but in live market this is to much difficult concept because in live market we have lots of problem like than may be we have limited fund and also we have lots of stocks but fund is limited so this concept is difficult.
About this image :-
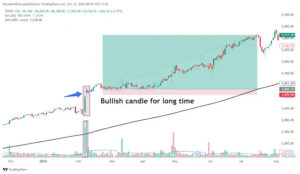
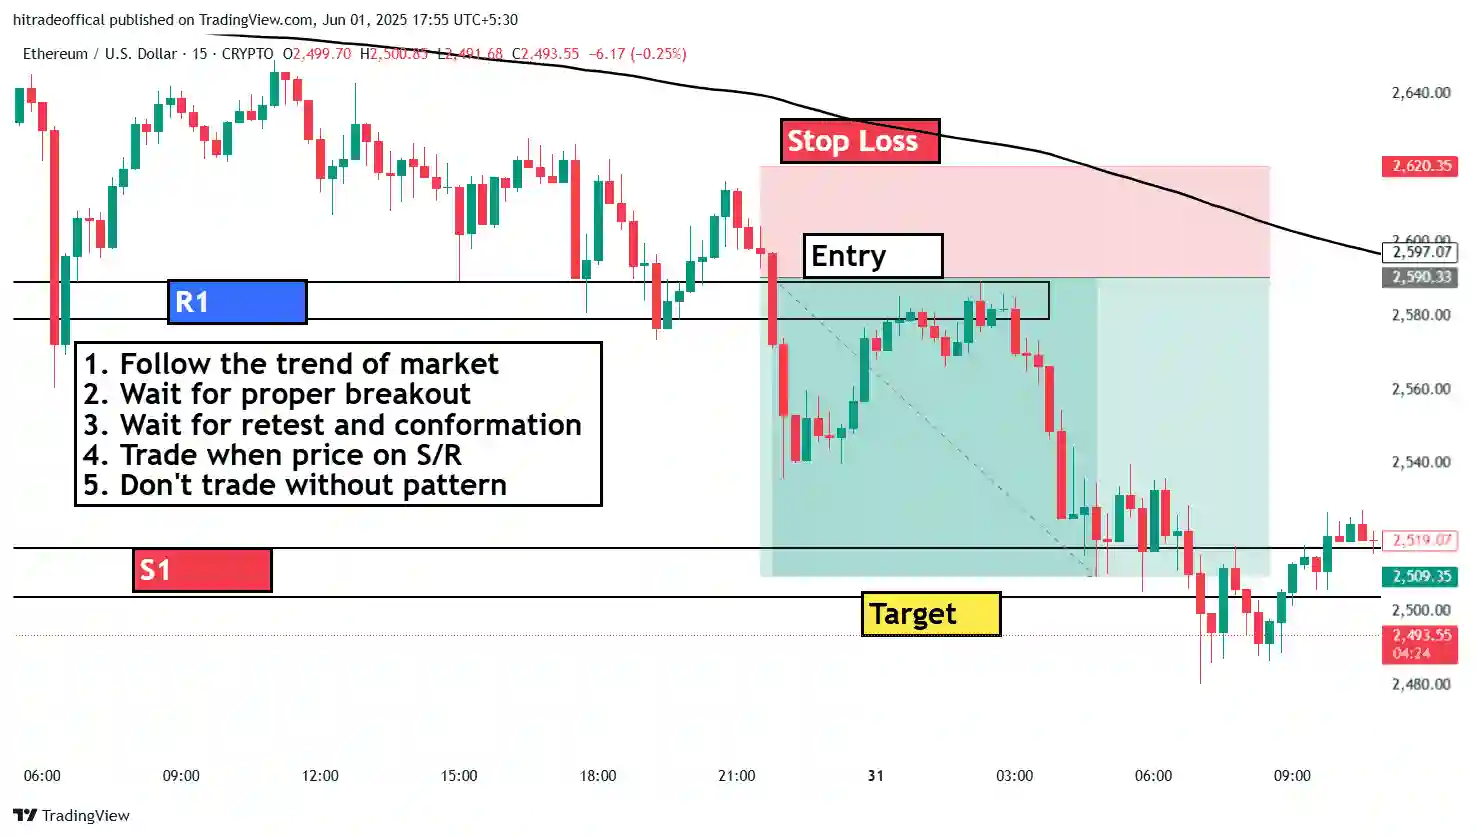
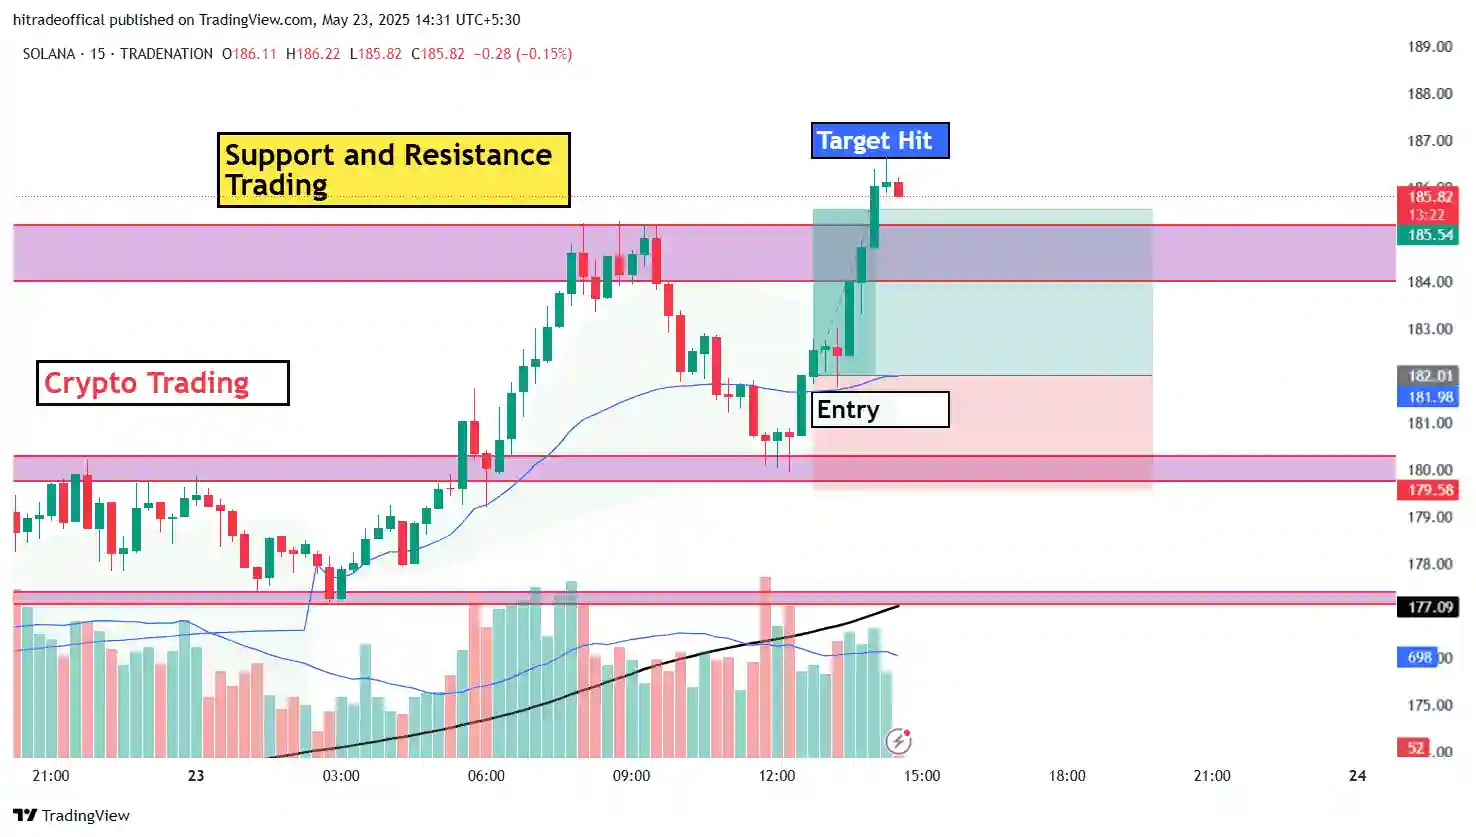
First you see last image and and image you see a bullish candle is form and in this image you can see that result of bullish candle this image is the same stocks and here you can see a great target hit only on the basic of this bullish candle.
How hit the target in this chart :-
The answer is when for this candle than maximum chance is hit the target and if you want to know how to hit the target than your answer is due to bullish candle hit the target so focus on this candle and use this candle only for investment and also you can try in swim trading as well as intraday trading.
About this image :-
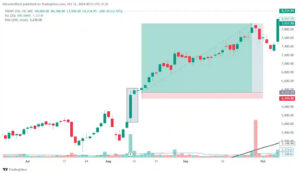
Now you see last two image and last two image you are seeing power of the bullish candle and here also this candle form on same stock and you can see the result of this candle on same chart and this chart is different but stock is same.
What is the difference between both chart :-
This image and that image only difference on the basis of chart not stock because in this image of stock same that image of stocks so difference only chart not stock and focus on this bullish candle sticks and make profit.
About this image :-
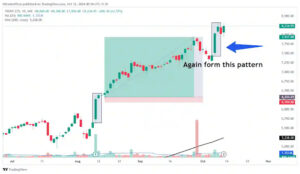
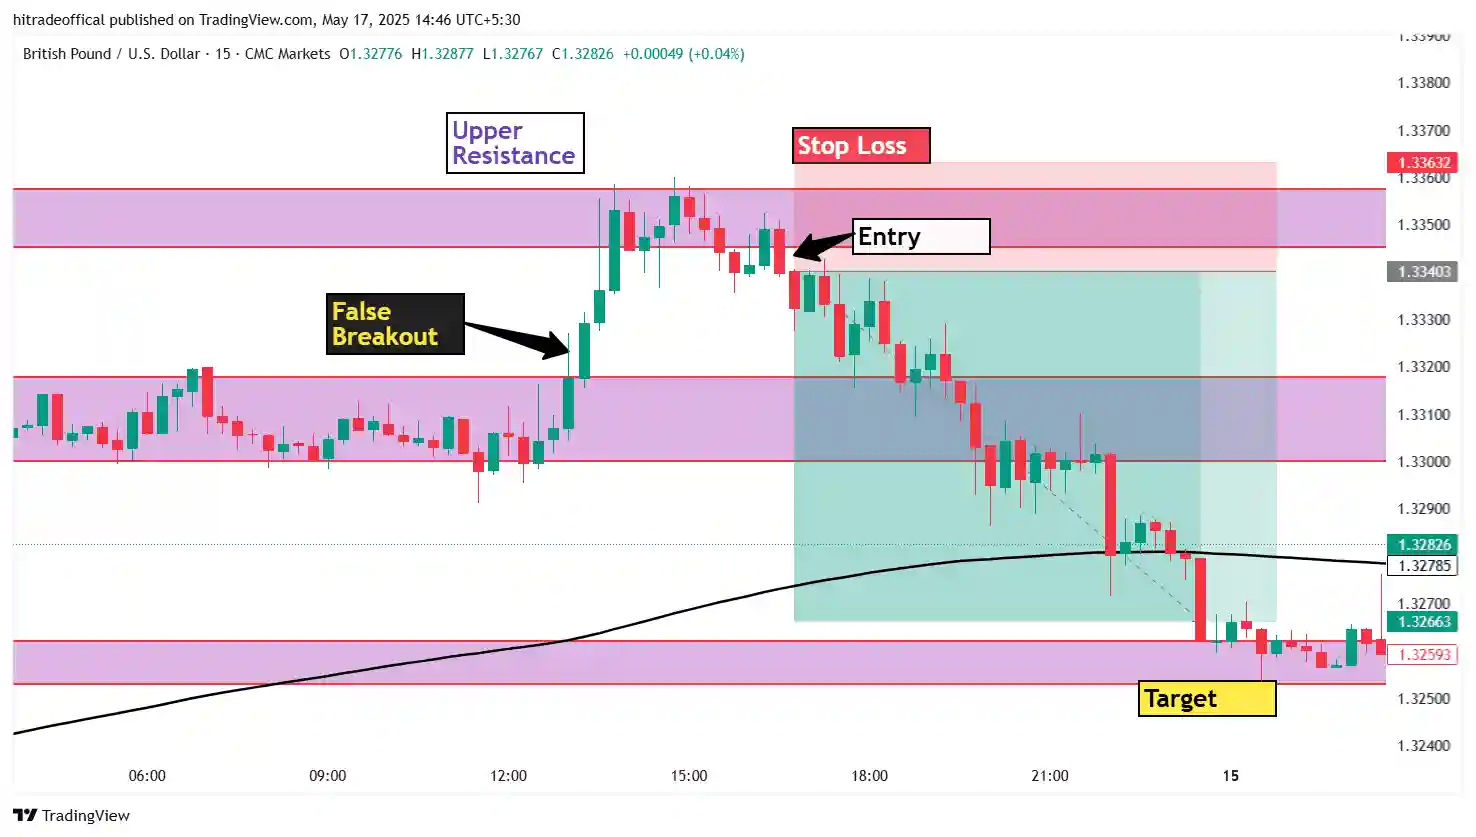
This is the last image of this post and I want to give a tips for your trading and only for education purpose so you can focus in this stock two time form bullish candle and give target both time and again form bullish candle in same stock and same time frame so you can focus on this chart.
How to choose stocks for long time investment :-
If you want to choose stocks for long time investment than there are lots of pattern you can use these pattern and test in market its result and also you can choose our pattern that means bullish candle pattern and test in live market if it is suitable for you than you can using this pattern choose stocks for long time investment.
How to trade using this pattern :-
When form this pattern and mark the chart and wait for green candle and when the green candle is form and its strength is good than you measure your stop loss and the stop loss is your range than you can trade using this pattern.
Is this work on Intraday trading :-
In intraday trading some time work and some time not work that means its depend upon situation so you can test this pattern in live market with small amount or paper trading but when situation is good than it work properly.
Learning of this post :-
In this post there are lots of learning first to first you have to see every image than see properly and watch how to work bullish candle in live market and if you want to invest your money in stock market for you can test this pattern in live market than its result is good than you can invest your money in stock market. This is the main point of learning of this post.
