Introduction :- In this post we learn about cup handle pattern which is very usable in forex trading and any other trading so must be learn about this pattern.
So first to first welcome to this article now keep learning and careful learning and enjoy every movement with learning.
What is Pattern in Trading?
A pattern in trading is a familiar shape or structure on a price chart that is utilized by traders to make future price direction predictions. Patterns are created through price action and show the psychology and behavior of the market participants.
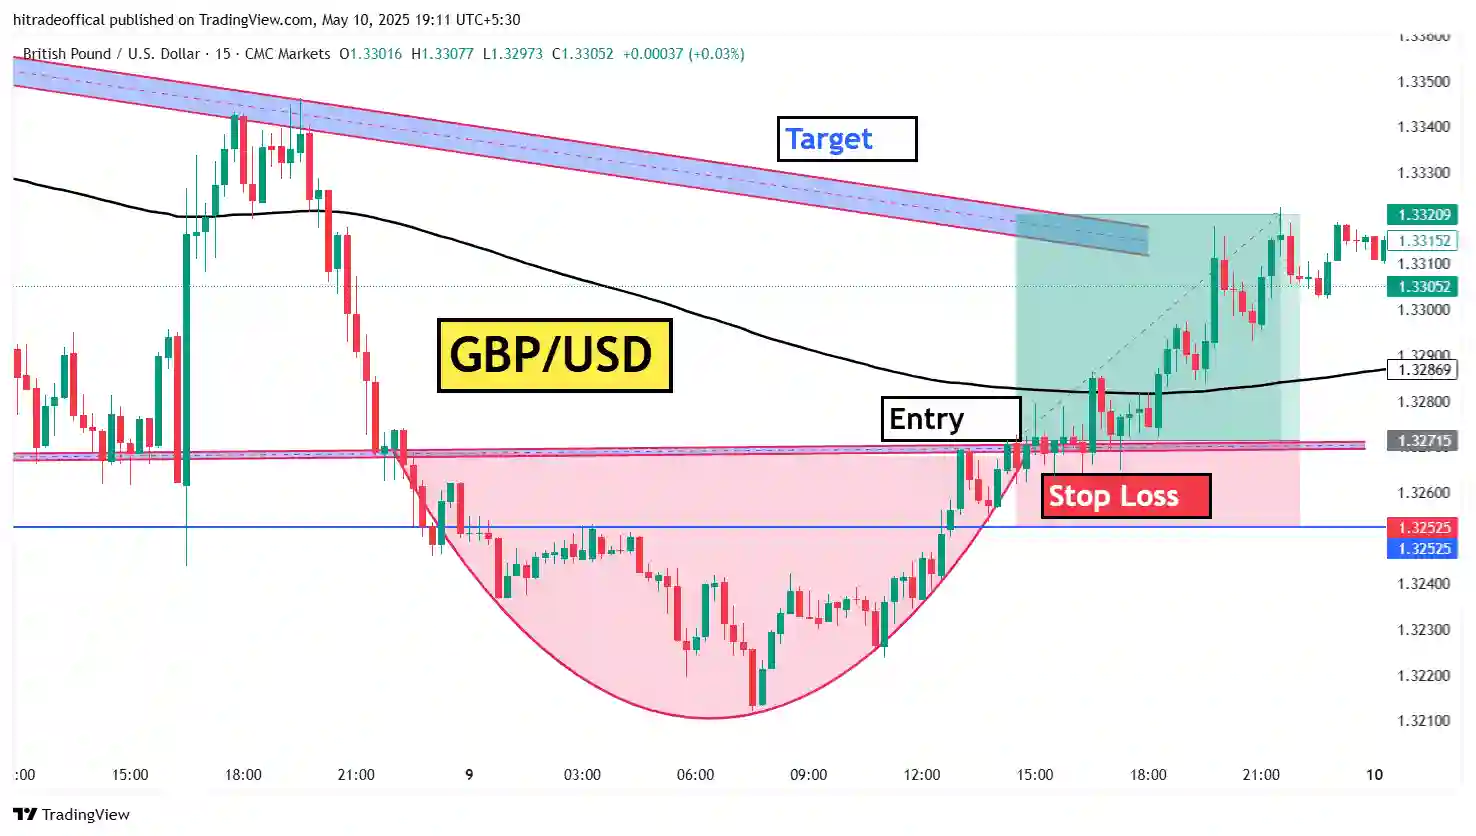
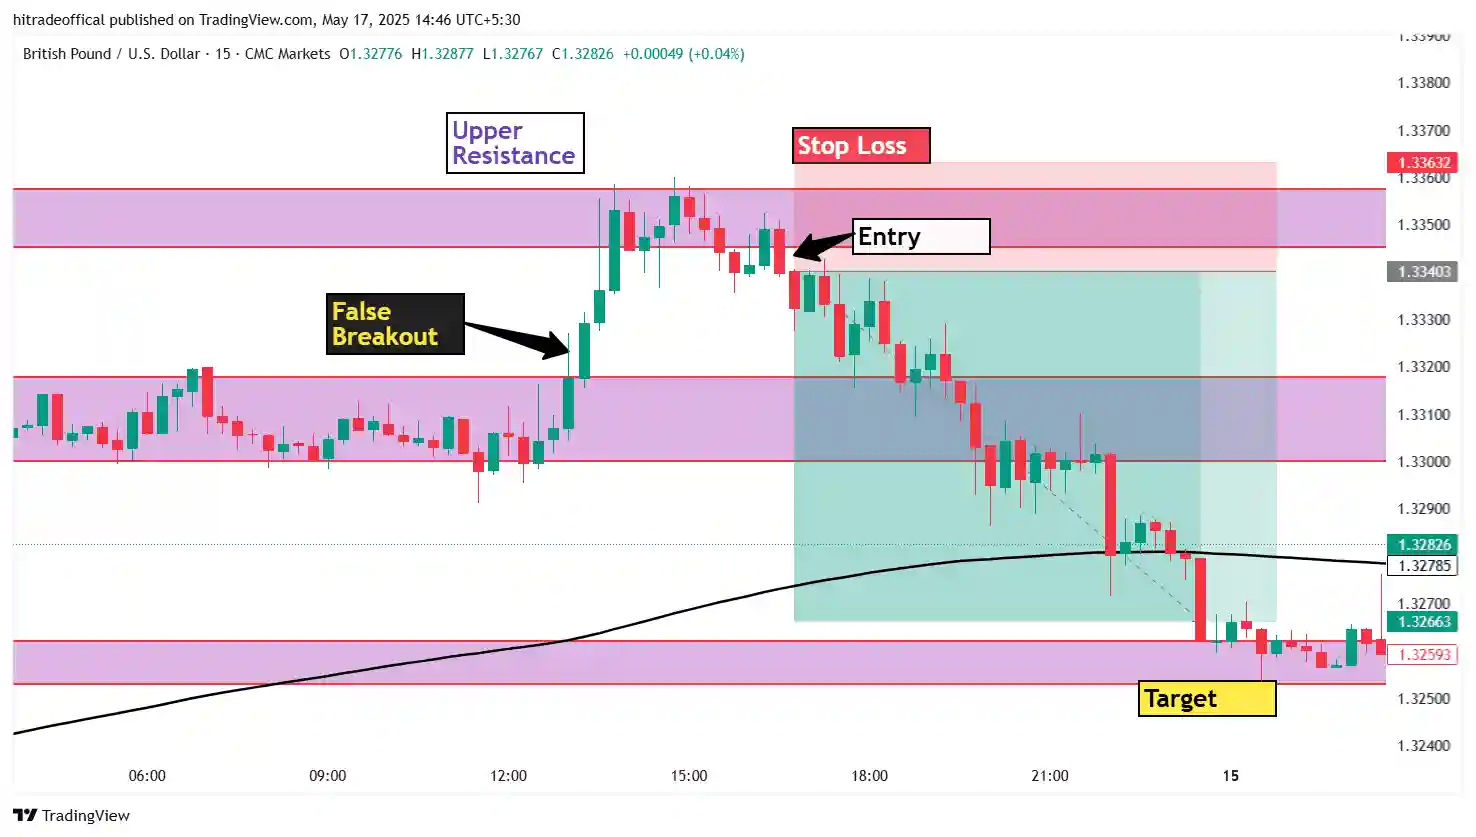
From the picture above, you can recognize an evident example of a chart pattern called the Cup and Handle pattern on the 15-minute GBP/USD chart.
???? Explanation Using the Chart Image:
Cup Formation (Pink Curved Area):
The price drops and then recovers slowly, creating a “U” shape. This indicates that sellers initially dominated, but buyers gained strength gradually, driving prices upwards.
Handle Formation:
Once the cup is completed, there is short-term consolidation or pullback shaping the “handle” — a minor dip which sets the market up for a breakout.
Breakout (Entry Point):
When the price crosses above the resistance level (approximately 1.32715), a long (buy) position is initiated — indicated on the chart as Entry.
Stop Loss:
For risk management, a stop loss is set below the handle (1.32525), in the event of a failed breakout.
Target:
The Target zone is determined by the cup’s height, with the aim of achieving a good risk-reward ratio.
???? Why Patterns are Important in Trading:
Such patterns assist traders in recognizing opportunities.
They are market psychology — demonstrating how buyers and sellers act.
They enable strategic planning, such as entry, stop loss, and profit objectives.
What is Cup Handle Pattern ?
The Cup and Handle pattern is a technical analysis bullish continuation pattern that indicates a possible upward breakout following a consolidation period, usually observed during uptrends.
???? Explanation Using the GBP/USD Chart:
Cup (Rounded Bottom):
In your chart, the price declines and then gradually increases, creating a rounded “U” shape — this is the cup. It indicates a steady transition from selling pressure to buying interest.
Handle (Small Consolidation):
The price then creates a brief sideways or downtrend movement — the handle. This small decline or consolidation is an indicator of a temporary pause before the price breaks higher.
Breakout (Entry Point):
When the price penetrates the resistance (the top of the cup), it sets off a bullish breakout, your Entry zone on the chart.
Stop Loss & Target:
Stop Loss is put just below the handle to control risk.
The Target is generally estimated on the basis of the height of the cup added over the breakout point — marked on the chart at 1.33209.
✅ Key Characteristics:
Pattern Shape: “U” followed by slight dip
Timeframe: May show on any timeframe (your chart is 15-minute)
Volume: Typically contracts in handle and expands on breakout
Signal: Bullish continuation (implies price will increase)
??? Why Traders Use It:
Clean entry, stop loss and target points
Good probability of success during trends
Well works when used in combination with other indicators
How to find Cup Handle Pattern in live market ?
Finding a Cup and Handle pattern in real-time can assist you in catching powerful bullish breakouts. Here is a step-by-step guide using the live example of the GBP/USD chart you provided:
✅ Step-by-Step Guide to Identifying the Pattern:
- Identify a Downtrend Followed by a Slow Recovery (The Cup)
In the live market, look for a rounded bottom following a price decline — this is the “cup”.
✔ On your chart, GBP/USD fell and then gradually rebounded, making a smooth “U” shape.
???? Tip: The cup is not V-shaped. A shallow, rounded cup is more powerful.
- Wait for a Small Pullback or Sideways Movement (The Handle)
After the price gets close to the previous high, it usually pulls back a bit or goes sideways — creating the “handle”.
✔ In your chart, GBP/USD consolidates slightly after creating the cup around 1.32715.
???? Tip: The handle must not go too deep (ideally, not below 1/3 of the height of the cup).
- Create the Resistance Line at the Cup’s High
Use a horizontal line at the top of the cup to indicate the breakout level. This is where the price needs to break out for the pattern to be confirmed.
✔ Your chart clearly indicates this — the breakout was at the Entry level indicated on the picture.
- Look for Breakout with Volume Confirmation
In live markets, a solid breakout above the handle with increasing volume is a primary entry signal.
✅ This is where your Entry is placed. Once it breaks out, price tends to rally fast.
- Set Your Trade Levels
Entry: At or slightly above the breakout line
Stop Loss: Below the handle low
Target: Measure the height of the cup and extend it above the breakout
✔ Your chart does this beautifully with Entry, Stop Loss, and Target labeled.
???? Tools to Use in the Live Market:
Use platforms such as TradingView to plot curves and trendlines.
Monitor lower timeframes (such as 15 min or 1 hr) for intraday trades.
Use Volume indicators or RSI for confirmation.
???? Pro Tip:
Cup and Handle patterns are best used in bullish or uptrending markets. Do not use them in sideways or highly volatile markets.
How to trade using Cup Handle Pattern ?
The Cup and Handle is a strong bullish continuation pattern that can be used by traders to enter high-probability trades. After identifying the pattern properly, making the trade is easy if you have a plan.
Let’s break it down step-by-step on your chart of GBP/USD as an example.
✅ Step-by-Step Guide to Trade the Cup and Handle Pattern
- Identify the Pattern
First, make sure that there is a presence of the Cup and Handle:
The Cup is an inverted “U”-shaped bottom
The Handle is a tiny dip or sideways movement at the top of the cup
✔ In your chart, there was a textbook cup and handle for GBP/USD on the 15-min chart.
- Draw Key Levels
Identify three important levels:
Resistance (Breakout Level): The handle’s top
Handle Support: Bottom of the handle (for stop loss)
Target: Gauge the cup depth and extend it above the breakout
✔ Your chart indicates:
Entry: Approximately 1.32715
Stop Loss: Approximately 1.32525
Target: Approximately 1.33209
- Plan Your Trade
Establish your trade according to the breakout:
Entry: Purchase when price closes above the resistance line (cup high)
Stop Loss: Set it just below the handle low
Take Profit (Target): Extend the height of the cup above the breakout level
- Confirm with Indicators (Optional)
Use volume or momentum indicators (e.g., MACD, RSI) for additional confirmation
Seek rising volume on the breakout
- Enter and Trade
Enter only after a definitive breakout (do not get fakeouted)
Trade with risk management by risking 1–2% of your capital
Take stop loss to breakeven once the price has moved half the way towards your target
???? Example from Your Chart (GBP/USD):
Pattern Formed: Cup and Handle
Breakout Occurred: Above 1.32715
Entry Taken: Shortly after the breakout
Stop Loss: Below the handle, at 1.32525
Target Hit: Around 1.33209 — ✅ Trade success
???? Pro Tips:
Don’t trade the pattern during a choppy or sideways market.
Bigger timeframes (1H, 4H, daily) usually provide more consistent patterns.
Use good risk-reward ratio — try to achieve at least 1:2.
How to make profit in trading ?
Trading can be lucrative, provided it’s done with the correct attitude, method, and discipline. Most traders lose money because they’re interested in only quick profits, not sustainable ways. Here is an easy-to-follow plan to make profits in trading consistently — forex, stocks, or crypto doesn’t matter.
✅ 1. Master the Fundamentals First
You need to know:
What you’re trading (Forex, stocks, commodities, etc.)
Fundamental concepts such as leverage, lot size, spread, pips, stop loss, and take profit
How charts operate: timeframes, candlesticks, indicators
???? Begin small, learn from YouTube, courses, or trading blogs such as yours (e.g., stockbharti.in).
✅ 2. Employ a Successful Trading Strategy
You require a consistent strategy. Some reliable ones are:
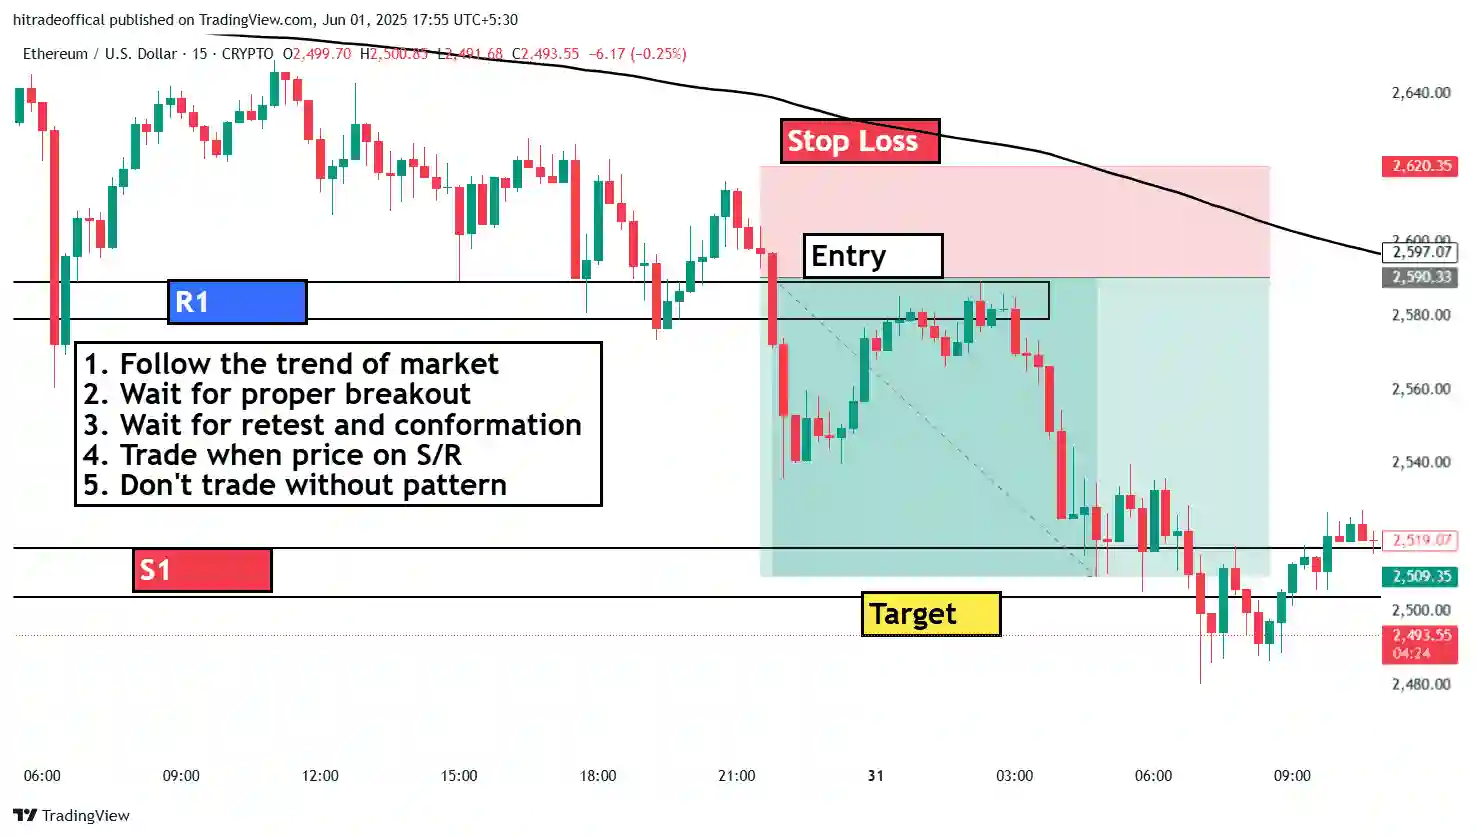
Breakout strategy
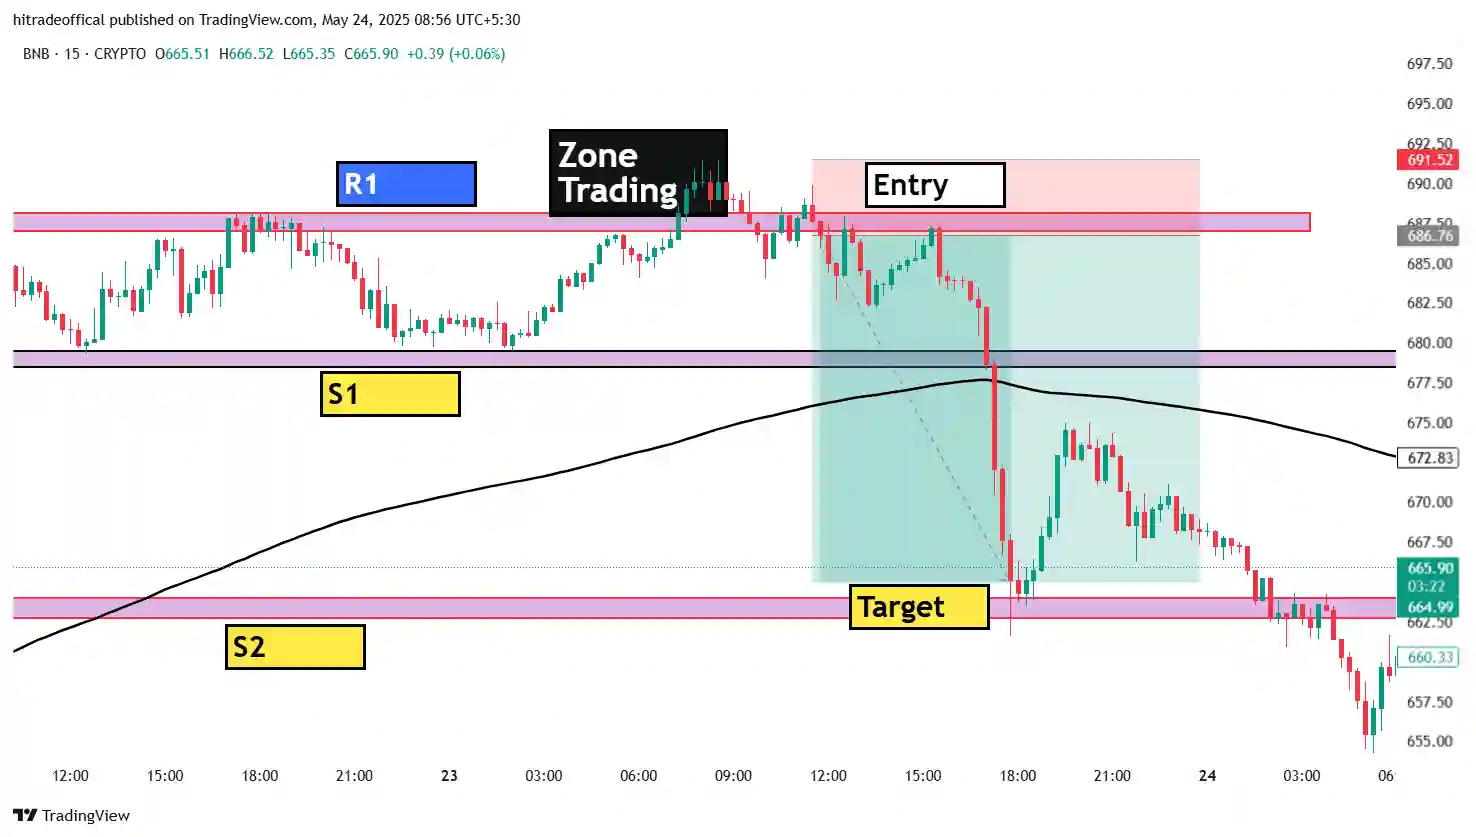
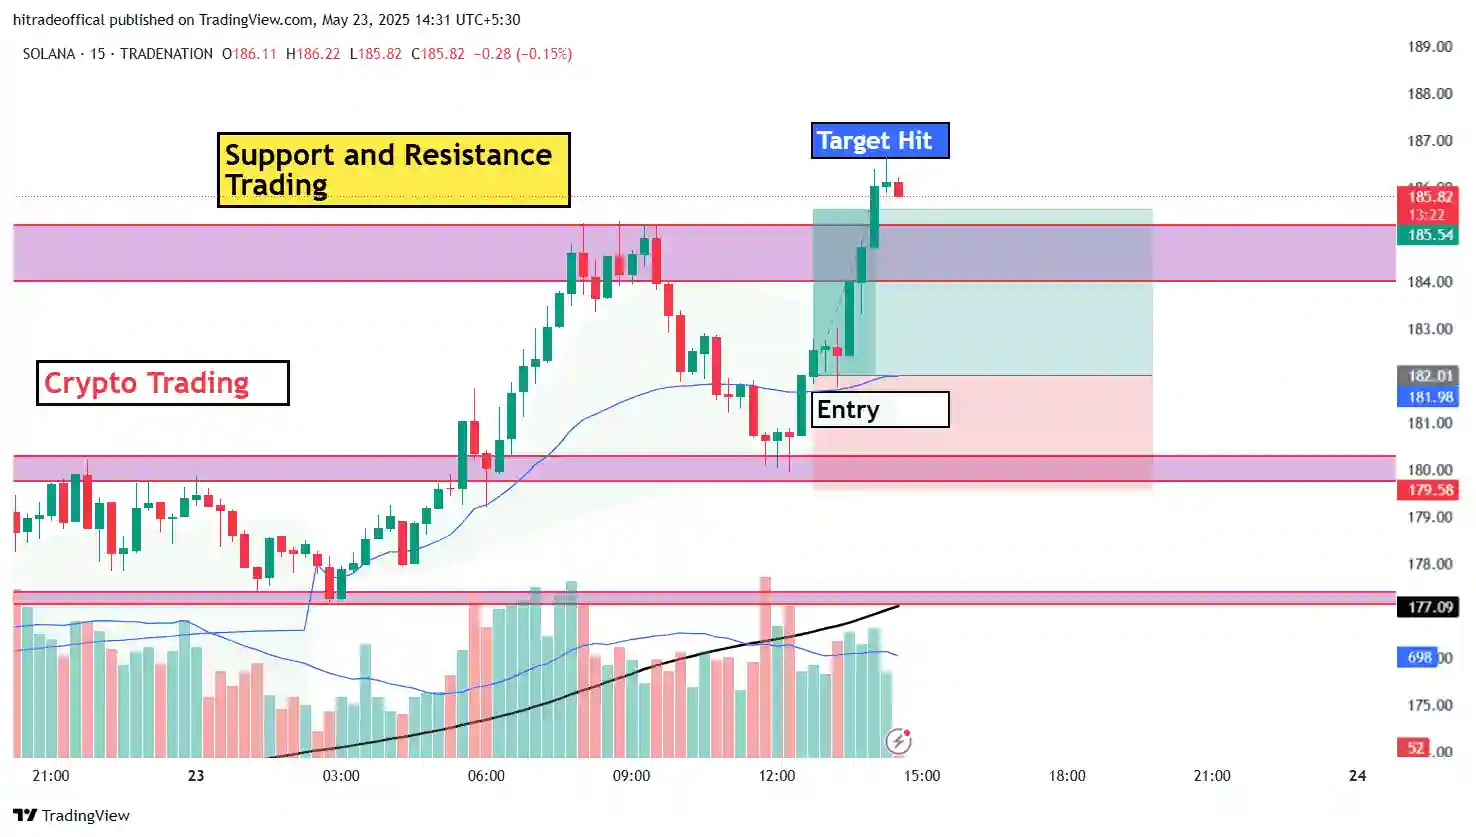
Support/Resistance trading
Cup and Handle pattern (similar to your picture)
Moving Average crossovers
Price Action + Volume analysis
???? Backtest your strategy on historical data prior to trading it on live markets.
✅ 3. Always Employ Risk Management
Even the best trades can go wrong, so manage your risk:
Risk only 1-2% of capital per trade
Use Stop Loss and Take Profit
Keep a Risk-to-Reward ratio of minimum 1:2
Example: Risk ₹100, try to make ₹200.
✅ 4. Trade with Discipline
Emotions are responsible for the failure of most traders. You need to:
Stay to your plan (no overtrading)
Refrain from revenge trading after a loss
Don’t rush into trades without analysis
???? Trading is 80% mind and 20% strategy.
✅ 5. Maintain a Trading Journal
Document each trade:
Why you entered
Entry, stop loss, target
Outcome
What you learned
???? It assists you in finding and correcting errors, and also helps you learn faster.
✅ 6. Demo Account First
Test your skills on a demo account before trading with real money. It builds confidence with no risk.
✅ 7. Grow Slowly, Start Small
Start small
Prioritize consistency, not overnight gains
Compound gains over time
???? Real-Life Example (From Your Chart):
Pattern: Cup and Handle
Entry: 1.32715
Stop Loss: 1.32525
Target: 1.33209
???? This trade was guided by technical rules and yielded a low-risk, high-reward gain.
???? Bonus Tip:
Master one setup in-depth (such as Cup and Handle), and apply it to various charts and timeframes — consistency is the key to profitability.
Conclusion :-
Consistent profitability in trading isn’t luck — it’s mastering the proper patterns, employing time-tested methods such as the Cup and Handle, and being disciplined with risk management. As the GBP/USD example illustrates, profitable trades are the result of planning, patience, and executing with accuracy. Learn one method thoroughly, have a good risk management plan in place, and always trade based on reason — not emotion. With repetition and consistency, profitable trading is downright achievable.
📚 Frequently Asked Questions (FAQs) ?
What is a Cup and Handle chart pattern in trading?
A Cup and Handle is a continuation bullish chart pattern that features a rounded bottom (cup) with a subsequent brief consolidation (handle) before prices break upward.
Is the Cup and Handle pattern sound?
Yes, it is ranked among the more sound bullish patterns, particularly on longer timeframes and when corroborated with volume or other confirmation indicators.
How do I spot a Cup and Handle pattern in live markets?
Be on the lookout for a “U”-shaped rebound following a price decline, then a minor dip or sideways motion (handle). Plot resistance at the high of the cup and wait for a breakout.
What timeframes are best suited for Cup and Handle patterns?
The pattern can be applied to any timeframe, but it is more consistent on higher timeframes such as 1-hour, 4-hour, or daily charts.
When do I enter a trade with the Cup and Handle pattern?
Enter the trade when the price breaks above the resistance (cup top) with high momentum or volume confirmation.
Where do I put my stop loss and take profit?
Stop Loss: Below the handle low
Take Profit: Measure the height of the cup and extend it above the breakout point
Can this pattern be applied in intraday trading?
Yes, intraday traders tend to employ the pattern on 5-min, 15-min, or 1-hour charts — such as the sample GBP/USD 15-minute chart you gave.
How do I validate a Cup and Handle breakout?
Employ such tools as volume spikes, RSI breaking above 50, or MACD crossover as confirmation indicators during the breakout.
How do I hedge risk when trading this pattern?
Never risk more than 1–2% of your capital. Always employ a stop loss and seek a minimum 1:2 risk-to-reward ratio.
Is trading Cup and Handle sufficient to generate consistent profit?
It’s a wonderful strategy, but success lies in the combination of it with risk management, discipline, and a good trading plan. No pattern assures profit by itself.


1 thought on “What is Cup Handle Pattern in Trading, How to trade using cup handle chart pattern”