Introduction :-
In this post we learn about US Oil chart pattern and best trading setup for us oil and also we discus about some practical chart pattern and chart analysis.
So first to first welcome to this article now keep learning and careful learning and enjoy every movement with learning.
How to start US Oil Trading :-
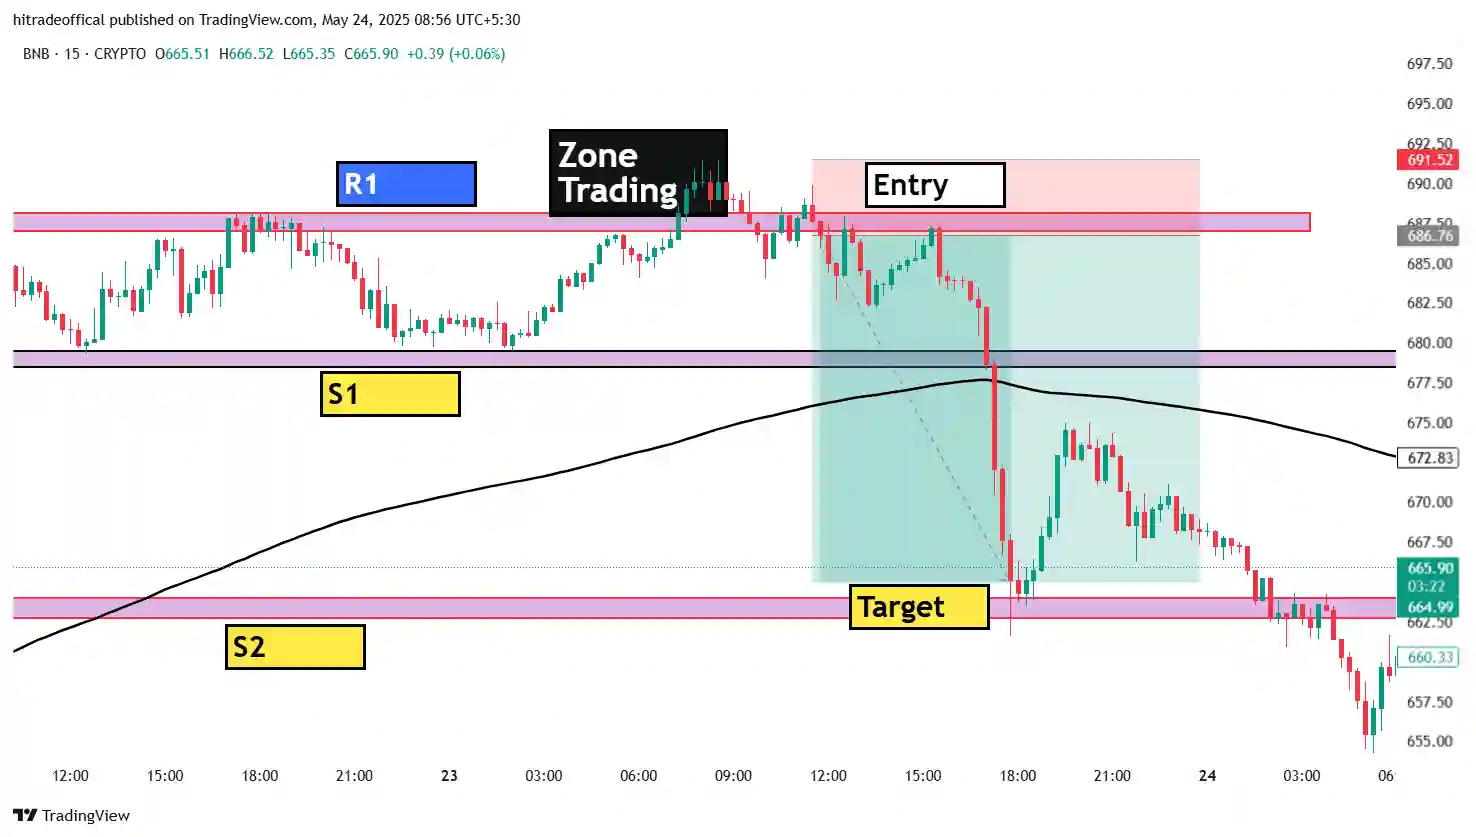
US Oil trading, especially in WTI Crude Oil, is a great way for traders to profit from global price movements. If you’re new and wondering how to start trading US Oil, let’s break it down with a real example shown in the chart above.
🔍 Step-by-Step Guide with Chart Explanation:
Start with a Demo Account
Practice oil trading with virtual money before going live. Learn how technical indicators, price action, and volume analysis work.
Understand the Market (WTI Crude Oil – USOIL)
US Oil is traded globally and its price is influenced by supply-demand, OPEC decisions, geopolitical news, and economic data. Most traders use WTI Crude Oil (USOIL) for trading.
Use a Reliable Charting Platform (like TradingView)
Platforms like TradingView help you read price action and find trade setups. The image above shows a 15-minute chart of USOIL.
Identify Key Levels – Support & Resistance
In the chart, the red shaded area is the resistance zone – where the price faced selling pressure multiple times.
This is where traders look for a reversal signal to enter a short position (sell).
Plan Your Trade: Entry, Stop Loss, and Target
Entry Point: When the price gets rejected from resistance.
Stop Loss: Placed slightly above resistance to limit your risk.
Target: Set near the next support zone – marked in yellow in the image.
Risk Management is Key
A successful oil trader always maintains proper risk-to-reward ratio. In the chart, the target was achieved smoothly, which shows a well-planned trade.
Which chart pattern is best for trading :-
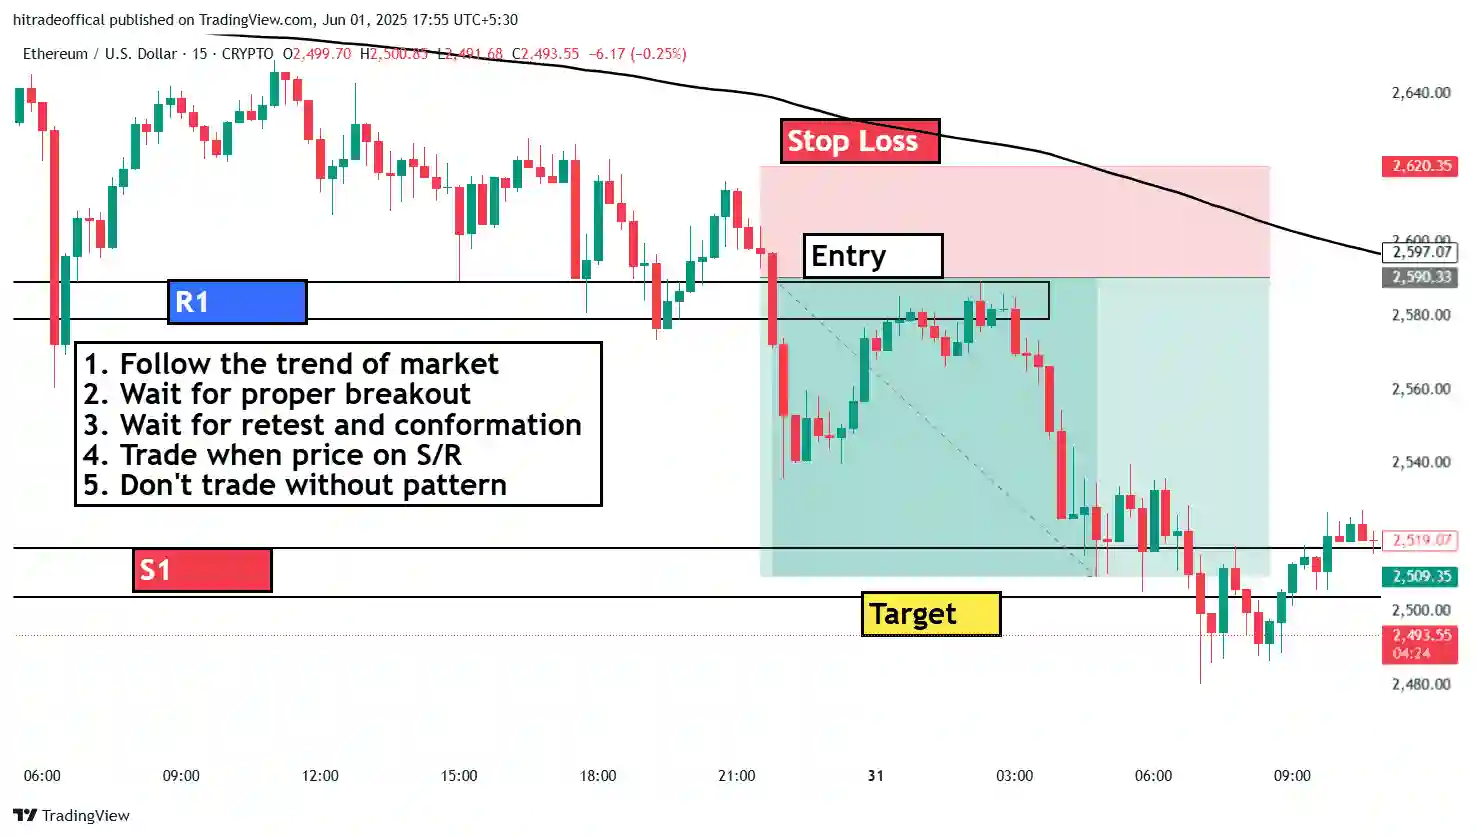
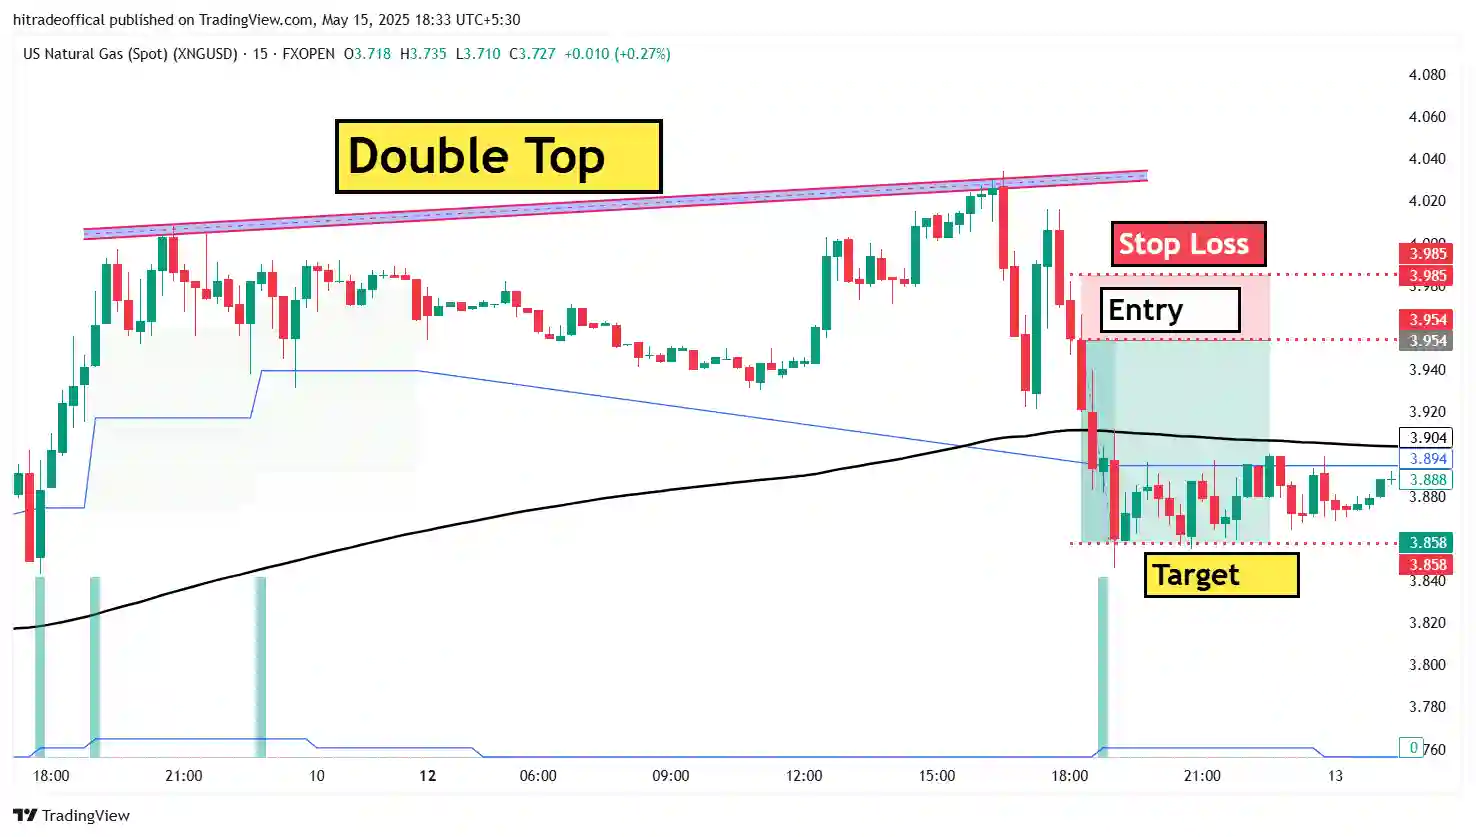
When it comes to trading, one of the most powerful tools is recognizing chart patterns. These patterns help predict future price movements based on past behavior. Among the many patterns, one of the most effective is the Resistance Rejection Pattern – as shown in the chart of WTI Crude Oil (USOIL) above.
🧠 What Chart Pattern is This?
In the image, we see a resistance zone where the price tried multiple times to break through but failed. This is a classic example of a “Double Top” or “Resistance Rejection” pattern, followed by a sharp downtrend.
Pattern Summary:
- Resistance Zone: Price repeatedly fails to go higher.
- Entry: After confirmation of rejection (marked as Entry).
- Stop Loss: Above the resistance zone to manage risk.
- Target: Set at the next support level (achieved as shown).
📈 Real-Life Example: WTI Crude Oil Trade
This USOIL chart clearly shows a short trade opportunity after a resistance rejection. The pattern provided a clear setup:
- Short below resistance
- Stop loss above the zone
- Target at support (successfully hit)
This type of chart pattern is highly reliable in commodities, forex, and index trading.
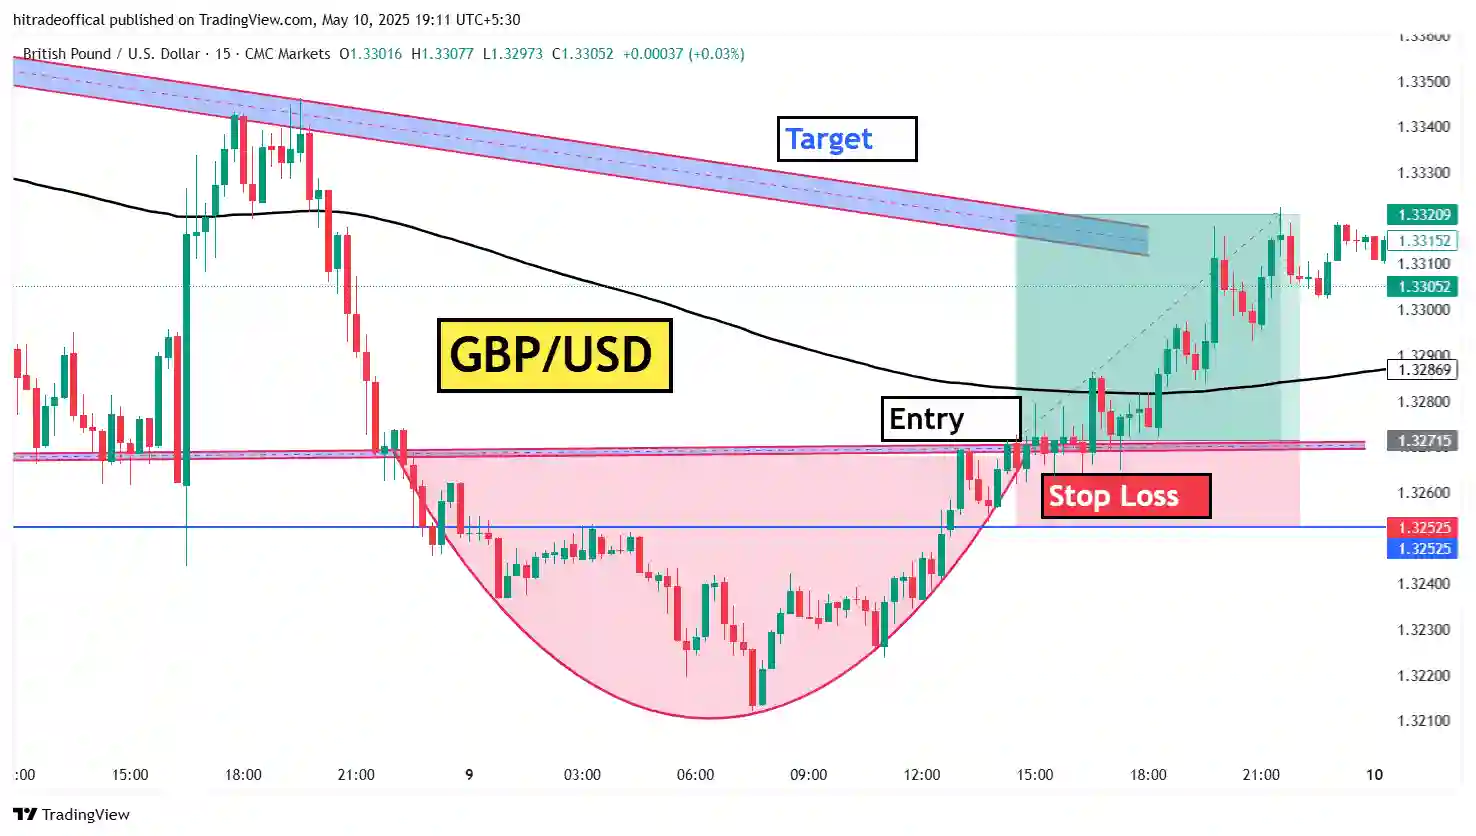
What is support and resistance :-
Support and resistance are two of the most important concepts in technical analysis. Whether you’re trading stocks, forex, or commodities like US Oil (WTI Crude), understanding these levels can help you make smarter trading decisions.
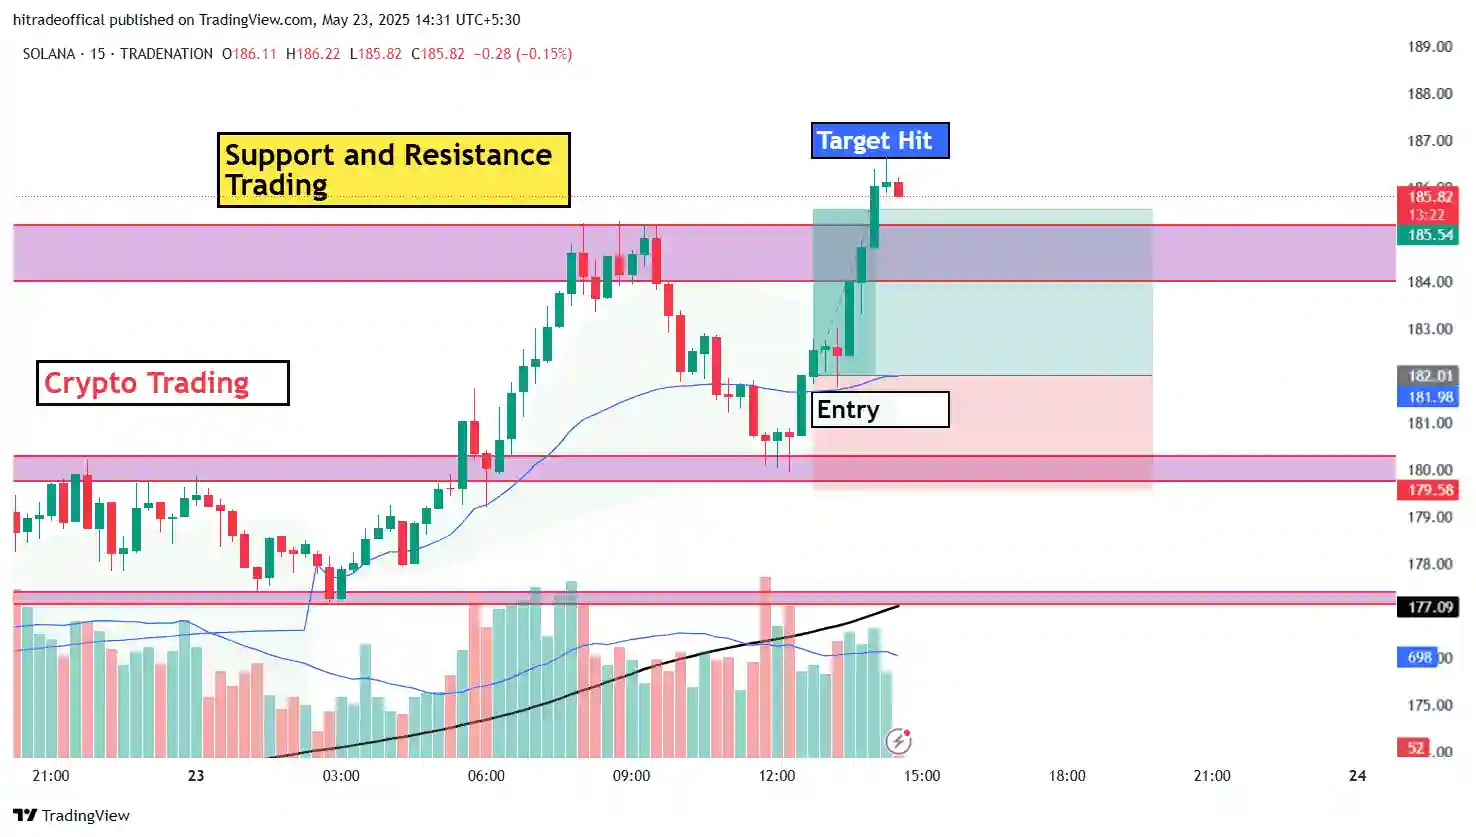
Let’s break it down using the real chart example shown above.
🟦 What is Resistance?
Resistance is a price level where an asset (like USOIL) struggles to go above. Sellers become active, pushing the price down.
👉 In the chart:
You can see the Resistance zone marked in red and blue. Every time the price reached that level, it dropped back – indicating strong selling pressure. Traders often enter sell trades here, expecting the price to fall.
🟨 What is Support?
Support is a price level where an asset tends to stop falling and may bounce back up. Buyers come in, creating upward pressure.
👉 In the chart:
The Target area (highlighted in yellow) acted as Support. Once the price hit that zone, it bounced slightly – showing buyer interest.
💡 Why Support and Resistance Matter in Trading:
- They help you plan your entry and exit.
- Great for setting stop loss and target.
- Work well with chart patterns like breakouts, rejections, and reversals.
- Common in price action trading strategies.
📊 Real Example Recap:
In this USOIL chart:
- Entry was made after price was rejected at resistance.
- Stop Loss was above the resistance (to protect against breakout).
- Target was set at the support level (which got hit successfully).
This setup is a textbook example of using support and resistance to plan a trade.
Does Support and Resistance Work in US Oil Chart Patterns?
Yes — Support and Resistance levels work extremely well in US Oil (WTI Crude) trading. These price zones are key tools in technical analysis, and traders around the world rely on them to make informed decisions, especially in high-volatility instruments like crude oil.
Let’s understand this better using the USOIL chart above.
🟩 Support and Resistance in the Chart: Real Example
- Resistance Zone (Sell Area):
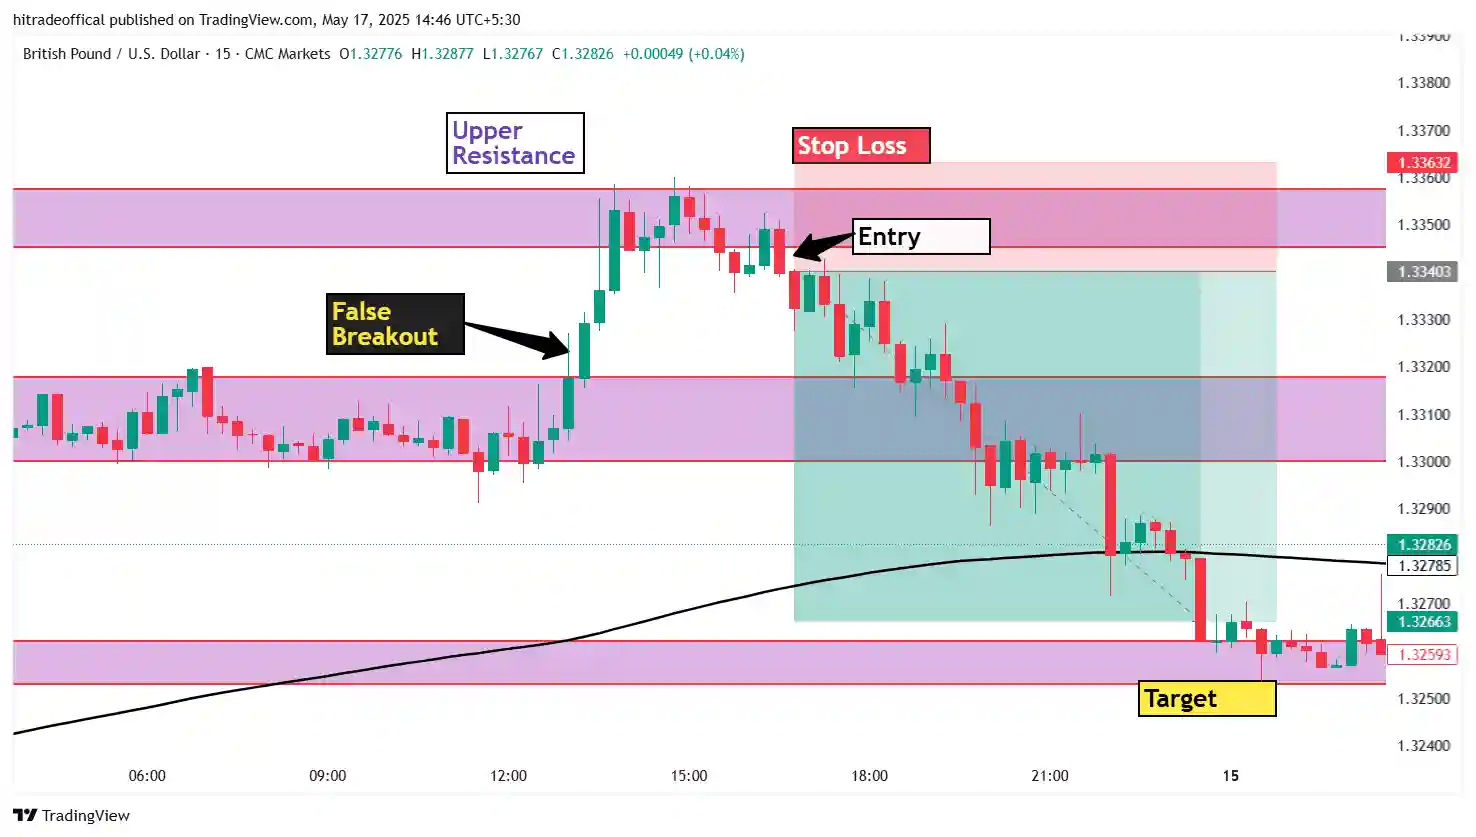
The red-shaded area shows a clear resistance zone where price touched multiple times and failed to break higher. This indicated strong selling pressure. - Entry Signal (Short Position):
After the resistance rejection, a sell entry was placed (as marked in the chart). This is a classic chart pattern rejection setup based on resistance. - Stop Loss:
Set above the resistance zone — in case the price breaks out, this protects your capital. - Support Level (Target Area):
The price moved sharply down and reached the support level, which was pre-marked as the target zone (in yellow). It bounced from there, showing buyer interest.
🔍 Why It Works in US Oil (WTI Crude):
- Crude oil is influenced by global news, supply-demand, and economic data, which causes price to react sharply at key levels.
- These zones act like walls — prices often reverse or consolidate here.
- Support and resistance are used in all timeframes, from scalping to swing trading in crude oil.
💡 Pro Tip for Traders:
Always combine support and resistance with other tools like volume, moving averages, or candlestick patterns to increase accuracy. The chart you provided is a perfect example of a resistance-based short trade using price action.
How to trade in live market :-
Trading in the live market means buying or selling assets like stocks, forex, or commodities in real-time based on market conditions. It requires a clear plan, fast decision-making, and strong technical analysis. Let’s learn how to trade in the live market using a real US Oil (WTI Crude) chart example.
🧭 Step 1: Analyze the Market in Real Time
Start by opening a live chart of the asset you want to trade — here, it’s USOIL (WTI Crude Oil) on a 15-minute chart. Watch how price behaves around important levels like resistance and support.
👉 In the chart:
You can see the price reaching a resistance zone where sellers become active. This is the first sign of a potential short trade setup.
🎯 Step 2: Plan Your Trade Before Entering
In live trading, planning is everything. Before you click buy or sell:
- Identify entry level
- Place a stop loss to limit risk
- Define your target for taking profit
👉 As shown in the chart:
- Entry was made after price rejected resistance.
- Stop loss was placed above resistance.
- Target was set at a logical support zone.
💡 Step 3: Execute the Trade (Live Order Placement)
Using your trading platform (like MT4, TradingView, or any broker terminal), place the trade based on your setup:
- Choose position size wisely
- Set SL and TP orders
- Monitor price movement live
📌 Note: Avoid emotional trading. Stick to your plan.
📉 Step 4: Manage the Trade
Once your order is live:
- Watch how price behaves around key zones
- If the market moves in your favor, stay patient
- If price hits your stop loss, accept it and move on — it’s part of the game
👉 In this example:
The price followed the plan exactly — dropping from resistance and hitting the target.
✅ Live Market Trading Tips:
- Use support and resistance for high-probability setups
- Always manage risk with a stop loss
- Focus on price action over indicators
- Trade only during high-volume sessions for better moves
Conclusion :-
Trading in the live market may seem challenging at first, but with the right strategy and discipline, it becomes a powerful way to grow your capital. As shown in the USOIL chart example, using key tools like support and resistance, clear entry points, stop loss, and target levels helps you make confident and calculated trading decisions.
By focusing on price action, planning your trades, and managing risk, you can trade smarter — not emotionally. Whether you’re trading crude oil, forex, or stocks, the core principles remain the same.
📌 Remember: Successful traders don’t guess — they prepare, react to patterns, and follow proven strategies.
📚 Frequently Asked Questions (FAQs) ?
What is live market trading?
Live market trading refers to placing buy or sell orders in real-time during market hours based on live price movements.
Is support and resistance enough to trade in the live market?
Support and resistance are strong tools, but combining them with volume, trend analysis, and candlestick patterns improves accuracy.
How can I trade US Oil (WTI Crude) effectively?
Use technical analysis with support/resistance zones, wait for breakout or rejection signals, and always apply a proper stop loss.
What time is best for trading crude oil?
The best time to trade crude oil is during US market hours (8 PM to 2 AM IST), when volume and volatility are highest.
Can I use price action trading in crude oil?
Yes, price action works very well in volatile commodities like US Oil, especially around key levels like shown in the chart.
How do I manage risk in live trading?
Always use a stop loss, limit your position size, and never risk more than 1-2% of your trading capital on a single trade.
Which chart pattern is best for US Oil trading?
Patterns like double tops, breakouts, inside bars, and resistance rejections are commonly effective in US Oil trading.
How do I find the right entry and exit points?
Identify key zones using support/resistance, wait for confirmation (e.g., candle rejection or breakout), and place your SL/TP accordingly.
Is live trading suitable for beginners?
Beginners should first practice on demo accounts, learn chart reading, and master strategies before risking real money.
What platform should I use to trade US Oil?
You can trade USOIL on platforms like TradingView, MetaTrader 4/5, or broker apps that offer CFD or futures trading.