Introduction
In the fast-paced world of trading, price action patterns remain one of the most reliable tools for traders of all levels. Among them, the Double Top pattern is a classic and powerful reversal signal, especially when trading high-volume commodities like Gold (XAUUSD). In this comprehensive guide, we’ll explore how to effectively identify and trade the Double Top pattern using real-world examples. The image below highlights a recent double top formation in the gold market that we will use to explain strategies, entry and exit points, and risk management.
What is a Double Top Pattern?
A Double Top is a bearish reversal chart pattern that forms after an asset reaches a high price two consecutive times with a moderate decline between the two peaks. The pattern is confirmed when the price breaks below the neckline, indicating a shift in momentum from bullish to bearish.
Key Characteristics:
- Two similar peaks (Top 1 and Top 2)
- A horizontal support line (neckline)
- A breakdown below the neckline with increased volume
- Strong bearish candle following the breakdown
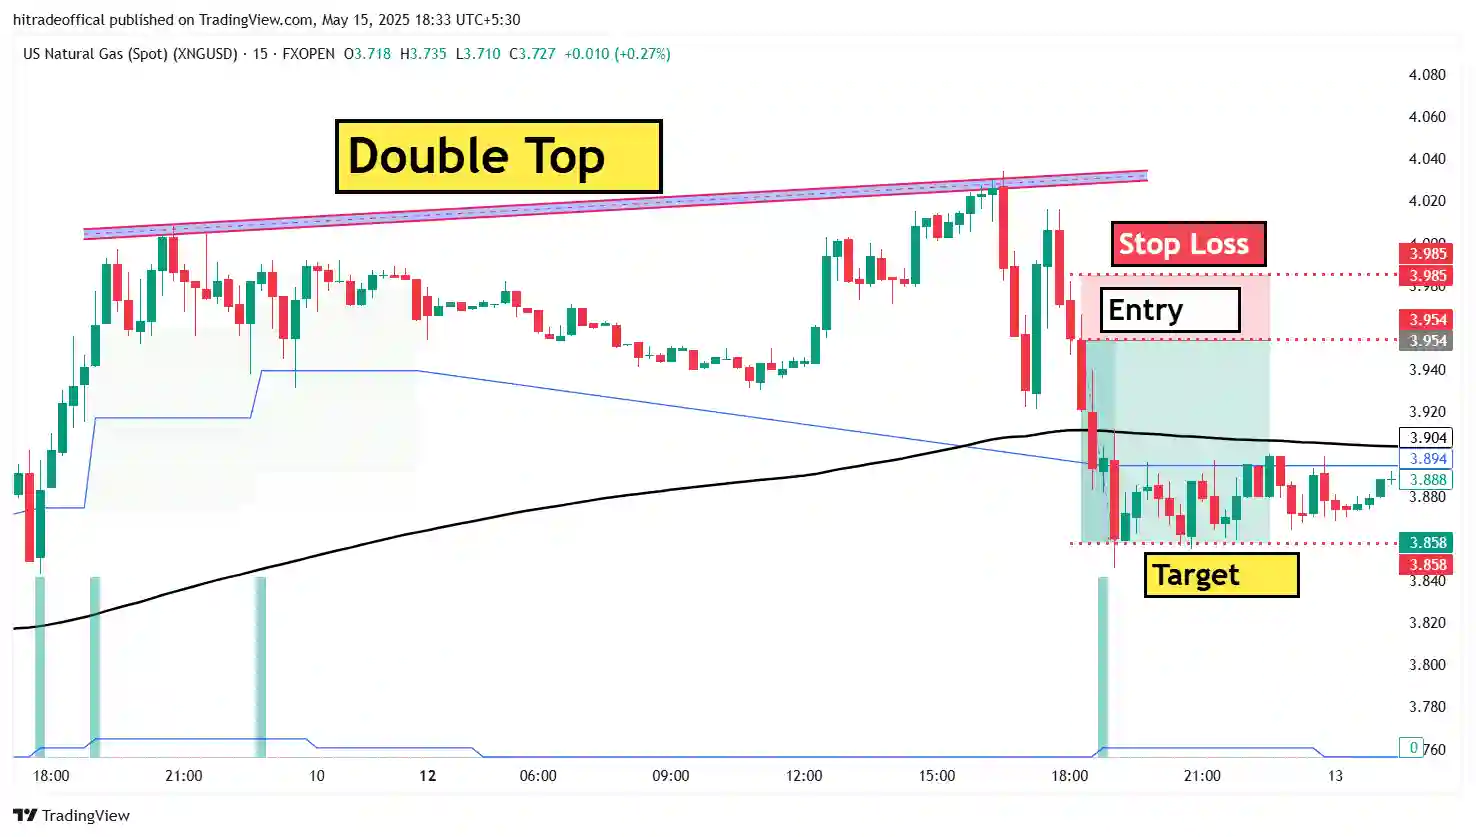
Example: XAUUSD Chart Breakdown
In the provided image, we can clearly observe:
- Top 1 forming at around 3,140 USD
- A slight decline followed by Top 2 at a similar level
- A confirmation of resistance near the highlighted zone
- Breakdown below 3,100 USD, followed by heavy selling pressure
Why Gold (XAUUSD) is Ideal for Pattern Trading
Gold is one of the most actively traded commodities worldwide. Its global demand, correlation with USD, and sensitivity to geopolitical and economic factors make it highly volatile—perfect for technical analysis strategies like the double top.
Key Reasons:
- High liquidity
- 24-hour market
- Global recognition as a safe-haven asset
- Responsive to macroeconomic news
Read more about gold fundamentals on Investopedia
Identifying a Double Top in Real Time
To effectively trade a Double Top, early identification is crucial. Here’s how you can spot it:
Step-by-Step:
- Observe the price approaching a resistance zone
- Watch for the first rejection (Top 1)
- Look for a pullback to the neckline
- Wait for the second attempt (Top 2) that fails to break the resistance
- Confirm the neckline breakdown on increased volume
Using tools like TradingView, traders can set alerts near resistance levels to catch potential double tops early.
Entry and Exit Strategy
Entry:
- Conservative traders: Enter after the neckline is broken with a strong bearish candle.
- Aggressive traders: Enter at the second top with a tight stop above the resistance.
Stop Loss:
- Above Top 2
- 1-2% depending on risk appetite
Take Profit:
- Measured by the height between the tops and neckline (projected downward)
Example:
- Top level: 3,140 USD
- Neckline: 3,100 USD
- Target: 3,060 USD (difference projected downward)
Risk Management and Position Sizing
No strategy is complete without proper risk control.
Rules to Follow:
- Never risk more than 1-2% of your trading capital
- Use trailing stops to protect profits
- Avoid revenge trading after stop-outs
Recommended Tools:
- ATR (Average True Range) for dynamic SL
- Volume profile for support/resistance zones
- RSI to check overbought conditions
Check out this risk calculator tool from BabyPips to manage your trades effectively.
Common Mistakes Traders Make
- Entering before confirmation: Wait for the neckline to break.
- Ignoring volume: Always look for volume spikes during the breakdown.
- Setting tight stop-losses: Give your trade some room to breathe.
- Overtrading: Don’t trade every double top. Wait for high-probability setups.
Double Top vs. Other Reversal Patterns
Double Top vs. Head and Shoulders:
- Double top is simpler, with two peaks.
- Head and shoulders includes three peaks with a higher middle.
Double Top vs. Triple Top:
- Triple top has three attempts to break resistance.
- Double top confirms quicker.
Advanced Techniques for Professional Traders
Combining with Indicators:
- MACD: Watch for bearish crossover
- RSI: Look for bearish divergence
- Fibonacci: Use 61.8% retracement to identify resistance zones
Multi-Timeframe Confirmation:
Always validate the double top on a higher timeframe (e.g., 1H or 4H) before executing trades on a lower one (e.g., 15m).
Trending International Keywords to Include:
- Gold trading strategy 2025,
- XAUUSD technical analysis,
- Best pattern for gold reversal,
- Commodity trading signals,
- Forex chart patterns,
- Double top gold strategy,
- Smart money concepts XAUUSD,
- Gold market predictions 2025,
Track international trading news on ForexFactory
Conclusion
The Double Top pattern is one of the most straightforward and reliable reversal indicators in trading. Especially in commodities like gold (XAUUSD), where technical analysis plays a major role, this pattern offers significant edge to traders who understand how to read it. By using proper entry rules, stop losses, and risk management, you can turn this simple structure into a powerful trading weapon.
Stay updated with live charts and technical setups by visiting HiTradeOfficial.com — your hub for international trading education.
Related Articles:
Frequently Asked Questions (FAQs)
1. What is a Double Top Pattern in Trading?
Answer:
A Double Top is a bearish reversal chart pattern that occurs when the price of an asset hits a resistance level twice with a slight dip in between. It signals that buying momentum is weakening and a downtrend may follow once the price breaks below the neckline.
2. How Can I Identify a Double Top on the Gold (XAUUSD) Chart?
Answer:
Look for two peaks at a similar price level, usually with declining volume, followed by a break below the neckline (support). Confirmation of the pattern often includes a strong bearish candle and a spike in selling volume.
3. Why is Gold (XAUUSD) Popular for Trading Double Tops?
Answer:
Gold is highly liquid, reacts predictably to global news, and shows strong technical responses, making it ideal for price action patterns like Double Tops. Its volatility creates clear and tradeable reversal signals for both short- and long-term traders.
4. What Are the Best Entry Points for a Double Top Trade?
Answer:
- Conservative Entry: After the neckline breaks and closes below with strong volume.\n- Aggressive Entry: Near the second top with a tight stop loss above resistance.
5. How Do I Set Stop Loss and Take Profit for a Double Top Pattern?
Answer:
- Stop Loss: Just above the second peak.\n- Take Profit: Equal to the height from the top to the neckline, projected downward from the breakout point.
6. What Indicators Can Confirm a Double Top Pattern?
Answer:
- MACD: Bearish crossover\n- RSI: Bearish divergence or overbought condition\n- Volume: Increase during neckline breakout adds confirmation
7. What Is the Difference Between a Double Top and Head & Shoulders Pattern?
Answer:
A Double Top has two similar peaks, while Head & Shoulders includes three peaks with the middle (head) being the highest. Both are reversal patterns but differ in structure and reliability.
8. Can a Double Top Fail? How to Avoid False Breakouts?
Answer:
Yes, false breakouts can happen. To avoid them:\n- Wait for a candle close below the neckline\n- Use volume confirmation\n- Confirm the pattern on a higher timeframe
9. What Are the Common Mistakes Traders Make with Double Tops?
Answer:
- Entering too early (before confirmation)\n- Ignoring volume\n- Setting too tight stop-losses\n- Trading every double top without proper risk analysis
10. Is the Double Top Pattern Still Effective in 2025 Markets?
Answer:
Absolutely. Despite algorithmic trading and AI tools, classic chart patterns like the Double Top remain highly effective, especially when combined with smart money concepts and proper risk management.
Disclaimer: This article is for educational purposes only. Trading involves significant risk. Always do your own research or consult a financial advisor before making decisions.