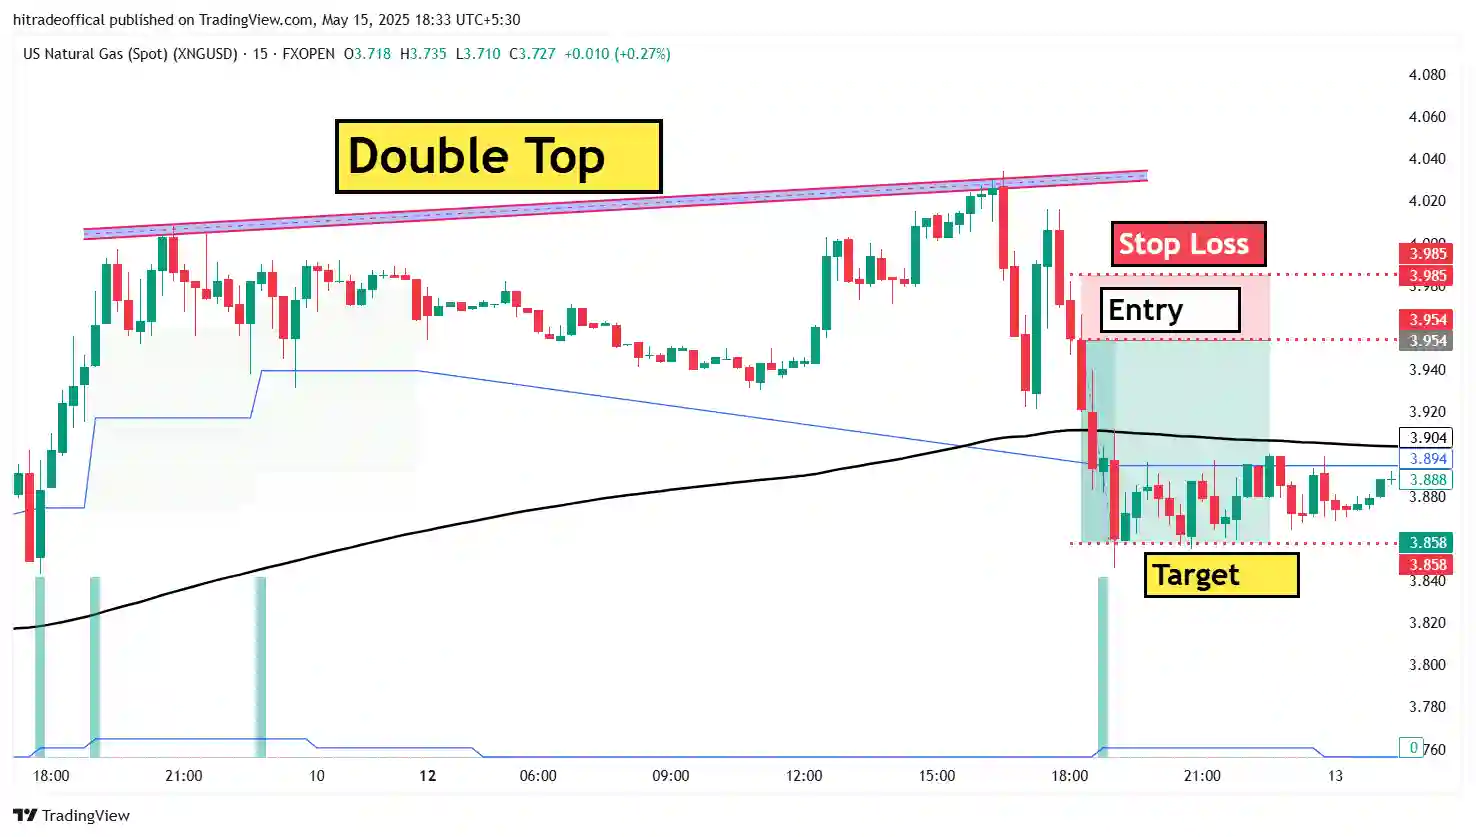
About this image :-
- In this image you can see that double top pattern is form and than after some time market will start falling in down side.
- Welcome to this post now keep learning and careful learning.
What is Double Top Pattern :-
The Double Top pattern is a well-known bearish reversal chart pattern that signals a potential shift in market direction. It forms after an extended uptrend, where the price reaches a resistance level twice but fails to break through. This pattern resembles the letter “M” on a price chart and indicates buyer exhaustion.
When the price reaches the same resistance level for the second time and starts to decline, it suggests that selling pressure is increasing. Traders often look for a neckline breakout, which is the support level between the two peaks. A confirmed breakdown below the neckline signals a potential trend reversal, making it an ideal point for short-selling opportunities.
This pattern is commonly seen in various financial markets, including stocks, forex, and commodities like crude oil (USOIL). Identifying a Double Top pattern can help traders make informed decisions and anticipate market movements effectively.
How to find double top pattern :-
Identifying a Double Top pattern is crucial for traders looking to spot trend reversals early. Here’s a step-by-step guide to finding this pattern on a price chart:
1. Identify an Existing Uptrend
Before a Double Top pattern can form, the market must be in a strong uptrend. This ensures that the pattern is a true reversal signal rather than a continuation pattern.
2. Look for Two Peaks at a Similar Price Level
The pattern consists of two distinct high points (peaks) that occur after an upward move. These peaks should be roughly at the same resistance level, showing that the price is struggling to break higher.
3. Observe the Neckline (Support Level)
The lowest point between the two peaks is called the neckline. This acts as a key support level. A valid Double Top pattern forms when the price breaks below this neckline, confirming a bearish trend reversal.
4. Watch for Decreasing Volume
Volume plays an important role in confirming the pattern. Typically, during the formation of the second peak, trading volume is lower than the first peak, indicating weak bullish momentum. A break below the neckline with high volume increases the chances of a successful breakdown.
5. Use Additional Technical Indicators
To strengthen the confirmation of a Double Top, traders often use indicators like:
- RSI (Relative Strength Index): If RSI shows a bearish divergence, it confirms weakening bullish strength.
- MACD (Moving Average Convergence Divergence): A bearish crossover can signal momentum loss.
- Moving Averages: If the price falls below key moving averages (like the 50-day or 200-day MA), it adds to the bearish signal.
By following these steps, traders can accurately spot and confirm a Double Top pattern to plan short trades or prepare for trend reversals in stocks, forex, or commodities like crude oil (USOIL).
How to test double top pattern :-
Once you have identified a Double Top pattern, it’s crucial to confirm its validity before making a trade. Many false signals can appear in the market, so proper testing ensures that the pattern is reliable. Here’s how to do it:
1. Confirm the Neckline Breakout
The neckline is the support level between the two peaks. A true Double Top pattern is only confirmed when the price breaks below the neckline with strong momentum. If the price does not break the neckline and instead moves back up, the pattern could be invalid.
2. Check Volume Confirmation
- The second peak should form with lower trading volume than the first peak, indicating weak buying pressure.
- The break below the neckline should happen with higher volume, confirming strong selling momentum.
If the neckline breaks with low volume, the pattern may fail, and the price could rebound instead of continuing downward.
3. Use Technical Indicators for Confirmation
To strengthen your analysis, use technical indicators to confirm the bearish reversal:
- RSI (Relative Strength Index): If RSI is above 70 at the second peak and then starts falling, it indicates bearish divergence and loss of buying strength.
- MACD (Moving Average Convergence Divergence): A bearish crossover in MACD near the second peak suggests momentum is shifting downward.
- Moving Averages: If the price falls below the 50-day or 200-day moving average, it adds more confidence to the bearish trend.
4. Wait for a Retest of the Neckline
After breaking the neckline, the price often retests this level before continuing downward. If the price pulls back to the neckline but fails to break above it, it confirms the pattern is valid, and traders can enter short positions with more confidence.
5. Measure the Price Target
To estimate the downside target, measure the distance from the peaks to the neckline and project the same distance downward from the breakout point. This helps in setting realistic profit targets.
Conclusion
Testing a Double Top pattern involves looking at multiple factors like neckline confirmation, volume, technical indicators, and price retests. By using these methods, traders can avoid false signals and increase their chances of successful trades in stocks, forex, and commodities like crude oil (USOIL).
What is an indicator in trading :-
In trading and technical analysis, an indicator is a mathematical calculation based on price, volume, or open interest that helps traders analyze market trends and make informed trading decisions. Indicators are used to identify trends, momentum, volatility, and potential reversal points in various financial markets, including stocks, forex, and commodities like crude oil (USOIL).
Types of Trading Indicators
Trading indicators can be broadly categorized into the following types:
1. Trend Indicators
These indicators help traders determine the overall direction of the market—uptrend, downtrend, or sideways movement.
- Moving Averages (MA) – Smooths out price data to identify trends.
- Bollinger Bands – Shows price volatility and possible trend reversals.
- Parabolic SAR – Helps traders find entry and exit points in a trending market.
2. Momentum Indicators
These indicators measure the strength and speed of price movements to identify overbought or oversold conditions.
- Relative Strength Index (RSI) – Shows whether an asset is overbought (>70) or oversold (<30).
- MACD (Moving Average Convergence Divergence) – Identifies trend changes and momentum shifts.
- Stochastic Oscillator – Compares the closing price of an asset to its price range over a certain period.
3. Volatility Indicators
These indicators measure how much an asset’s price fluctuates over time, helping traders adjust risk management strategies.
- ATR (Average True Range) – Measures market volatility and helps set stop-loss levels.
- Bollinger Bands – Expands and contracts based on price volatility.
4. Volume Indicators
These indicators analyze trading volume to confirm the strength of a price movement.
- OBV (On-Balance Volume) – Tracks volume flow to determine buying and selling pressure.
- Volume Weighted Average Price (VWAP) – Helps identify the average price an asset has traded at throughout the day.
Why Are Indicators Important in Trading?
- Helps Identify Trends – Indicators like Moving Averages help traders spot trends early.
- Improves Decision-Making – Momentum indicators like RSI and MACD help traders time their entries and exits.
- Manages Risk Effectively – Volatility indicators assist in setting stop-loss levels to minimize risk.
- Confirms Trade Signals – Combining multiple indicators helps traders avoid false signals and improve accuracy.
Conclusion
Trading indicators are essential tools for technical analysis, helping traders make better trading decisions in stocks, forex, and commodities like USOIL. While indicators can enhance trading strategies, they should be used in combination with price action and market fundamentals for the best results.
When Can We Trade on Double Top Pattern?
The Double Top pattern is a powerful bearish reversal signal, but timing your trade correctly is crucial for maximizing profit and minimizing risk. Here’s when you can trade this pattern effectively:
1. After the Second Peak is Confirmed
- The pattern is only valid when the price forms two clear peaks at the same resistance level.
- If the price is still rising after the second peak, wait for rejection from the resistance level before considering a trade.
🔹 Tip: Look for bearish candlestick patterns like Doji, Shooting Star, or Bearish Engulfing at the second peak for confirmation.
2. On the Neckline Breakout
- The most reliable entry point is when the price breaks below the neckline (the support level between the two peaks).
- A strong bearish breakout with high volume confirms that sellers are in control.
🔹 Tip: Avoid trading if the breakout happens with low volume, as this could be a false breakout.
3. After a Retest of the Neckline
- Sometimes, after breaking the neckline, the price pulls back to retest the broken support (now acting as resistance).
- If the price fails to move back above the neckline and shows weakness, it is a confirmation to enter a short trade.
🔹 Tip: Use indicators like RSI and MACD to confirm bearish momentum before entering a trade.
4. When Market Conditions Align
- The Double Top pattern works best in markets with high liquidity and volatility, such as forex, stocks, and commodities like USOIL.
- Avoid trading during major economic events or news releases that can cause unexpected price spikes.
🔹 Tip: Check the economic calendar for upcoming events that might impact your trade.
5. Setting Stop Loss and Take Profit
- Stop Loss: Place a stop loss above the second peak to protect against false breakouts.
- Take Profit: Measure the distance between the peaks and the neckline and set the same distance downward as your profit target.
🔹 Tip: Use a risk-reward ratio of at least 1:2 to ensure good trade management.
Conclusion
The best time to trade a Double Top pattern is when the price:
✅ Forms two clear peaks at resistance.
✅ Breaks below the neckline with strong volume.
✅ Retests the neckline and gets rejected.
By combining technical analysis, market conditions, and proper risk management, traders can increase their profitability and success rate when trading this pattern in forex, stocks, or commodities like crude oil (USOIL).
What is Time Frame in Trading?
In trading and technical analysis, a time frame refers to the specific period in which price movements are analyzed on a chart. Traders use different time frames based on their trading style, strategy, and market conditions to make informed decisions in stocks, forex, and commodities like crude oil (USOIL).
Types of Time Frames in Trading
Time frames are generally categorized into three main types:
1. Short-Term Time Frames (Intraday Trading)
⏳ Examples: 1-minute (M1), 5-minute (M5), 15-minute (M15), and 30-minute (M30) charts
📌 Best For: Scalping and Day Trading
📉 Usage:
- Used by scalpers and day traders for quick trades.
- Ideal for capturing small price movements within the same trading session.
- Requires fast decision-making and high trading frequency.
🔹 Tip: Use indicators like VWAP, RSI, and MACD to confirm entry and exit points.
2. Medium-Term Time Frames (Swing Trading)
⏳ Examples: 1-hour (H1), 4-hour (H4), and daily (D1) charts
📌 Best For: Swing Trading
📉 Usage:
- Suitable for traders holding positions for a few days to weeks.
- Helps capture larger price swings without the need for constant monitoring.
- Used to spot trend reversals, breakouts, and consolidations.
🔹 Tip: Combine moving averages, trendlines, and Fibonacci retracement to identify key levels.
3. Long-Term Time Frames (Position Trading & Investing)
⏳ Examples: Weekly (W1) and Monthly (M1) charts
📌 Best For: Position Trading & Investing
📉 Usage:
- Used by long-term investors and position traders.
- Helps identify macro trends and fundamental shifts.
- Focuses on economic data, earnings reports, and global events.
🔹 Tip: Use fundamental analysis along with technical indicators like 200-day moving average (MA) and MACD crossovers.
How to Choose the Right Time Frame?
The best time frame depends on your trading style and goals:
| Trading Style | Time Frame | Holding Period |
|---|---|---|
| Scalping | 1M, 5M, 15M | Seconds to Minutes |
| Day Trading | 5M, 15M, 30M, 1H | Few Minutes to Hours |
| Swing Trading | 1H, 4H, 1D | Few Days to Weeks |
| Position Trading | 1D, 1W, 1M | Months to Years |
🔹 Tip: Always analyze multiple time frames before entering a trade. A higher time frame confirms the trend, while a lower time frame helps refine entry and exit points.
Conclusion
A time frame in trading determines the period of price analysis, impacting strategy, risk, and trade duration. Whether you’re a scalper, day trader, swing trader, or investor, choosing the right time frame is essential for success in forex, stocks, and commodities like USOIL.
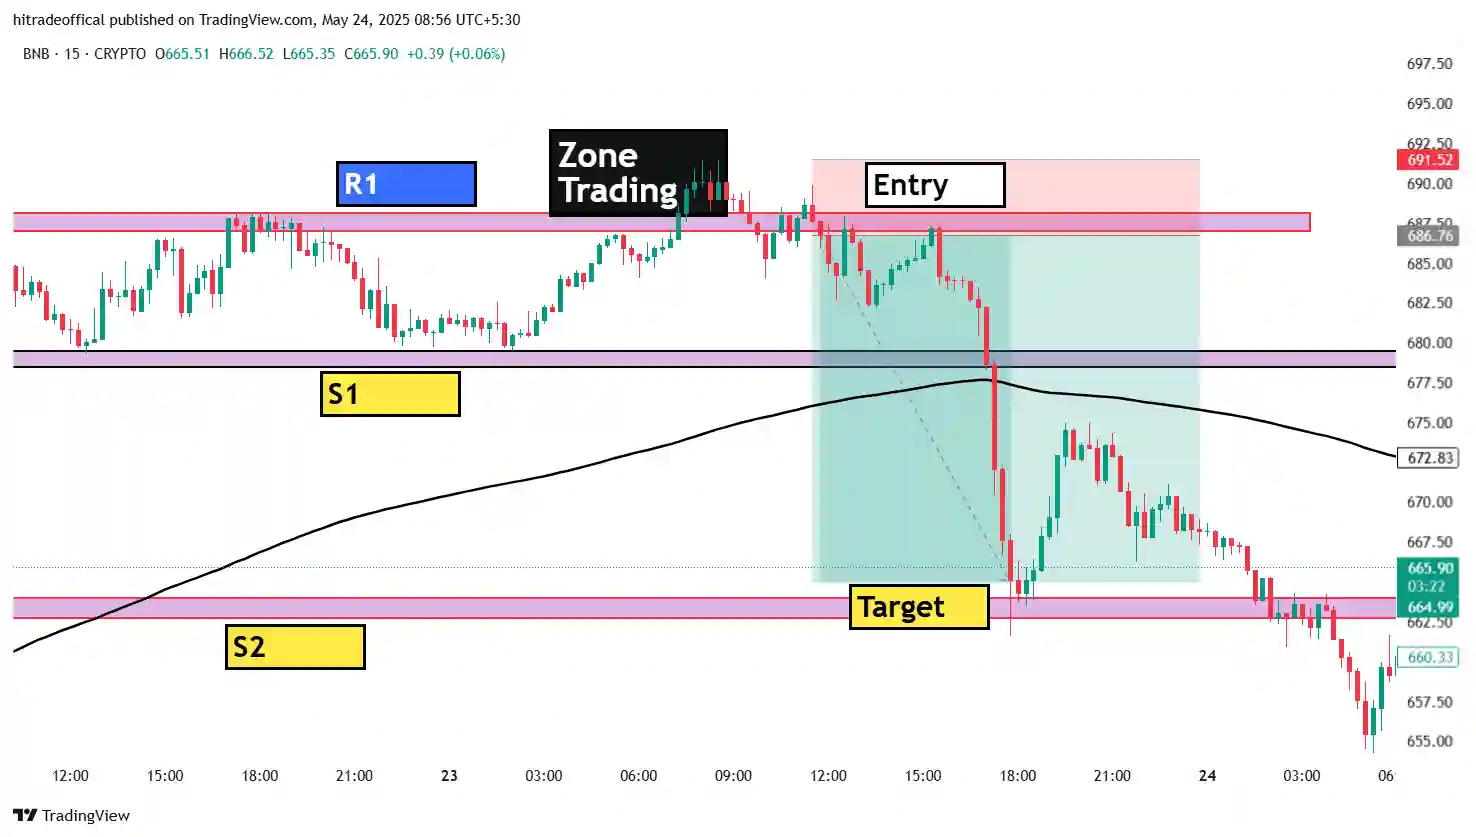
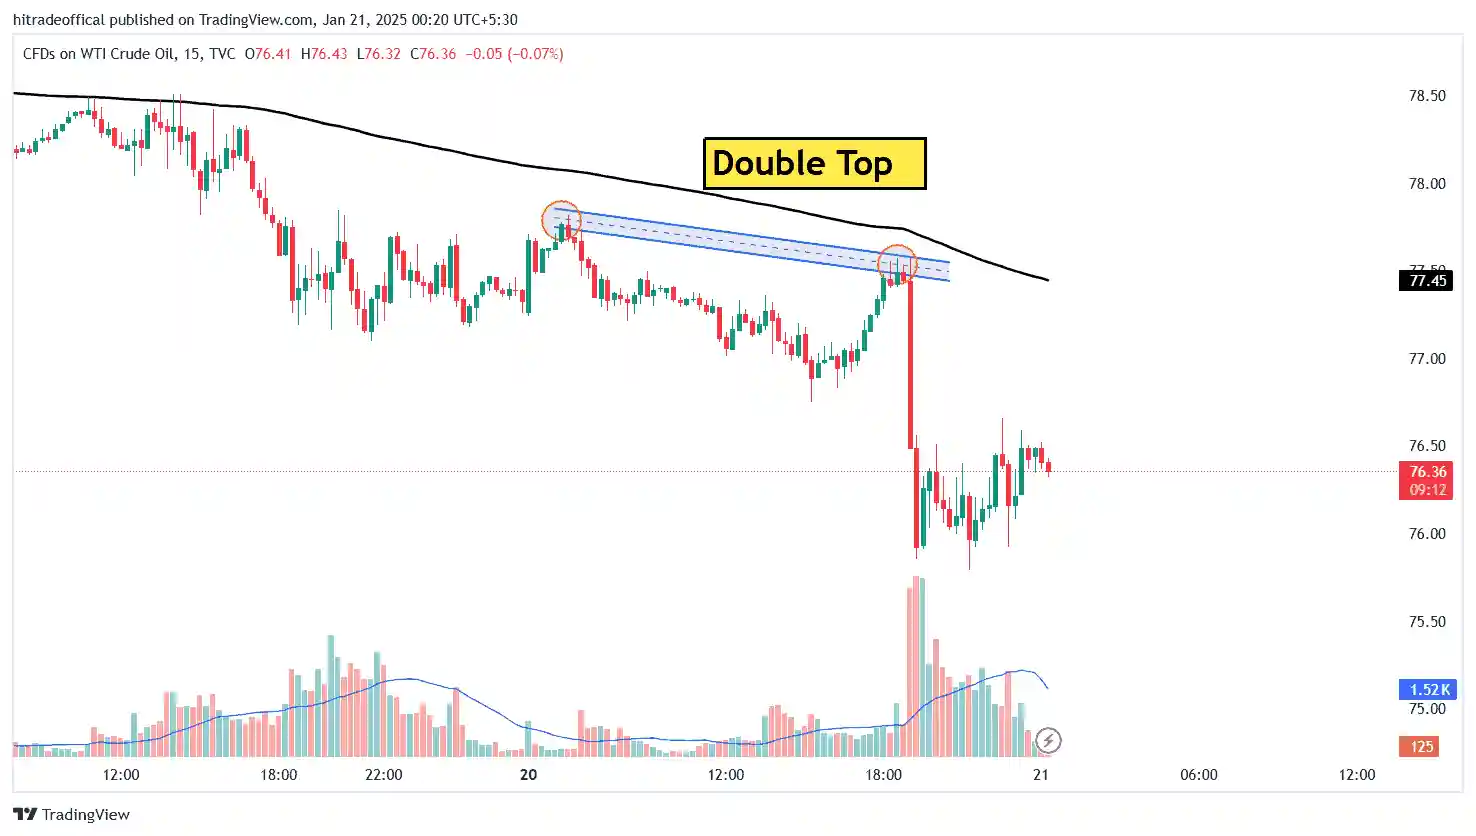
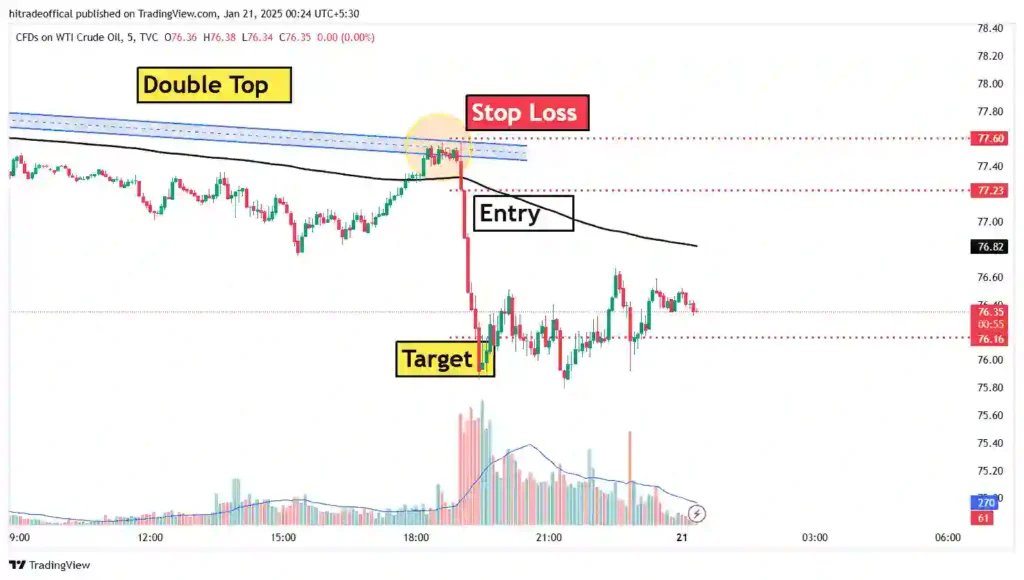
This is the image of also US Oil but in different time frame :-
About this image :-
- Here you can see that this is also same US Oil chart but in different time frame because you can see that some importance of different time frame.
- In this topic we talk about where is our entry point, stop loss point and target point also you can see that in image recent levels.
What is our Entry Point :-
In US Oil trading for entry time is most important and also in every forex trading time is very very important like you can see on chart some particular time volume is big and also movement is good.
When movement is good that is our best entry time so first to first focus on time after than focus on chart pattern or price action.
In this image you can see that after some time consolidation give a big red candle and also give big volume that means all sellers will active on that time so this is good time for entry.
If you miss that entry point than also after some time if you see chart than price again coming toward previous support than again you can take entry if you have good patience.
So, overall if you see and fell the chart than you can say that chart give more opportunity but we have no patience so we loss our capital and saying trading is a gambling.
What is our Stop Loss Point :-
In this post also we are not saying number form what is our stop loss point but according to chart we are saying what is our stop loss point.
In forex trading as well as long time trading maximum trader try to avoid this point but you don’t try to avoid this point.
Because using this point you can protect your capital and you can easily safe your money if you don’t want to waste your money than don’t try to avoid this point.
So, now if you need stop loss than you can take logical point as well as you can set in your mind if price reached that point than I will exist.
May be this point is logical but this process is protecting your capital as well as your money so don’t try to avoid this.
What is our Target Point :-
There are lots of method to find your target point some methods are following :-
- The first method is you can take target according to logical point. like that logical point is anything.
- The second method is you can book target using technical methods.
- The third method is according to nearest support or resistance.
- The fourth method is you can book your target using percentage like that you can set in your mind when this trade hit 10% out of our capital than I will book profit.
This way you can easily find your target point. Here, we said four methods you can use any one method and you can easily book your target.
What is the learning of this post :-
There are lots of learning point in this post like that :-
- The first learning of this post is What is Double Top Pattern.
- The second learning of this post is How to find double top pattern.
- The third learning of this post is How to test double top pattern.
- The fourth learning of this post is What is indicator in trading.
- The fifth learning of this post is When we can trade of double top pattern.
These are first five for learning of this post. If you want to learn than you can use these titles for learning and according to these you can learn easily.
Thank You For This Post And For More Update You Can Follow On YouTube