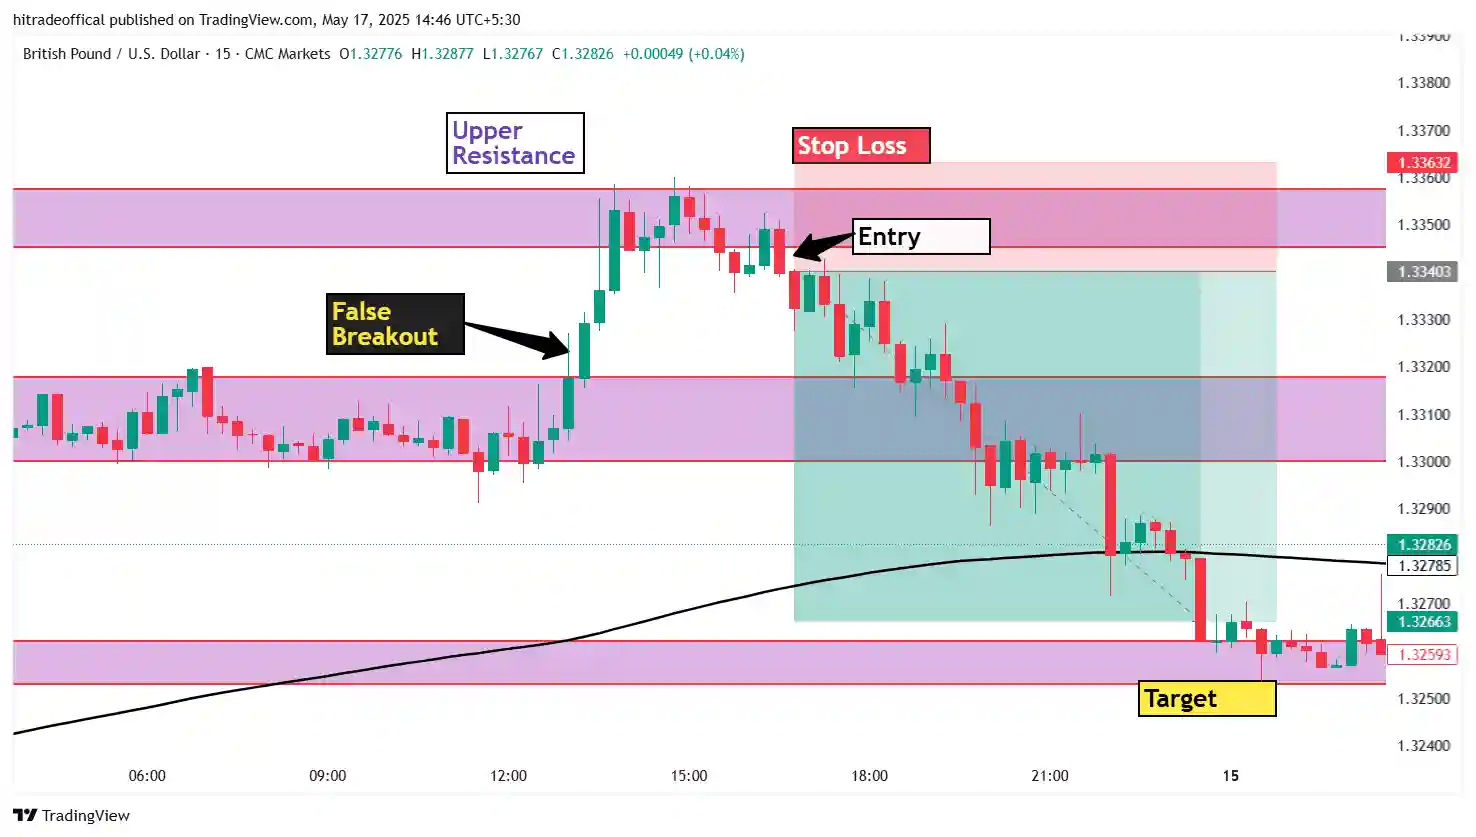
Introduction Trading breakouts is a common strategy used by traders to capitalize on market movements. However, false breakouts can often trap traders who enter trades prematurely. In this article, we will discuss how to identify and trade false breakouts effectively, using the example of crude oil (WTI) from the given chart.
What is a False Breakout?
A false breakout occurs when the price moves beyond a key support or resistance level but fails to sustain momentum, quickly reversing in the opposite direction. Traders often get trapped in false breakouts, leading to losses.
Key Characteristics of a False Breakout
- Price temporarily moves above/below a support or resistance level.
- High volume but no strong follow-through.
- Reversal candlestick patterns (like pin bars or engulfing candles).
- Price moves back within the previous range.
Why Do False Breakouts Occur?
False breakouts happen due to multiple reasons, including:
- Market Manipulation: Institutional traders or big players push the price beyond key levels to trigger stop-losses before reversing it.
- Low Liquidity Periods: During low trading volume sessions, prices may spike temporarily but fail to sustain momentum.
- News-Driven Moves: Sudden news events can create volatility, leading to short-lived breakouts.
- Psychological Levels: Traders often place stop-losses near obvious support/resistance levels, making them easy targets for market makers.
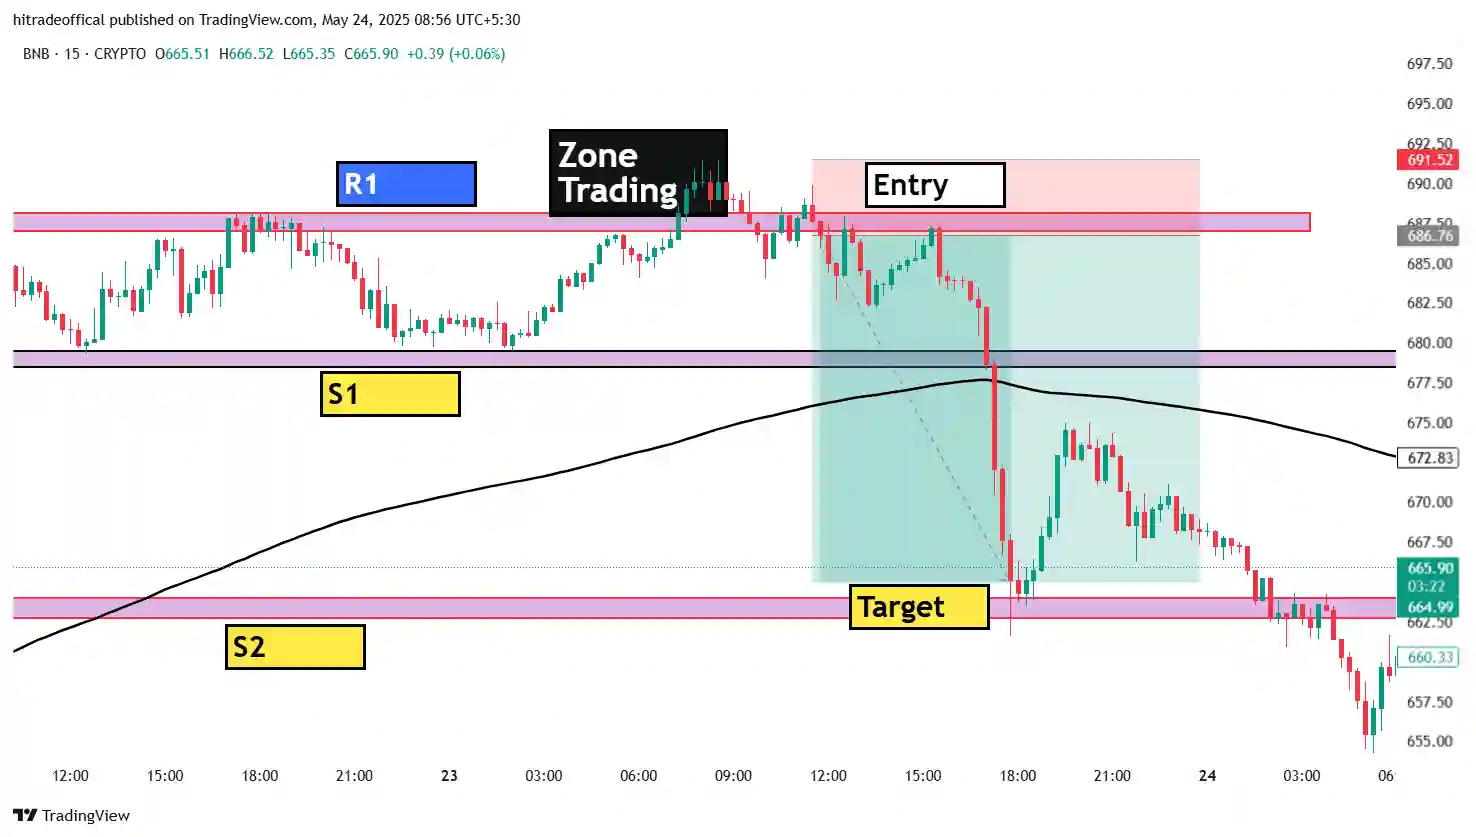
Understanding the Trading Setup (WTI Crude Oil Example)
The provided chart illustrates a well-defined trading setup using a false breakout strategy. Let’s analyze each component:
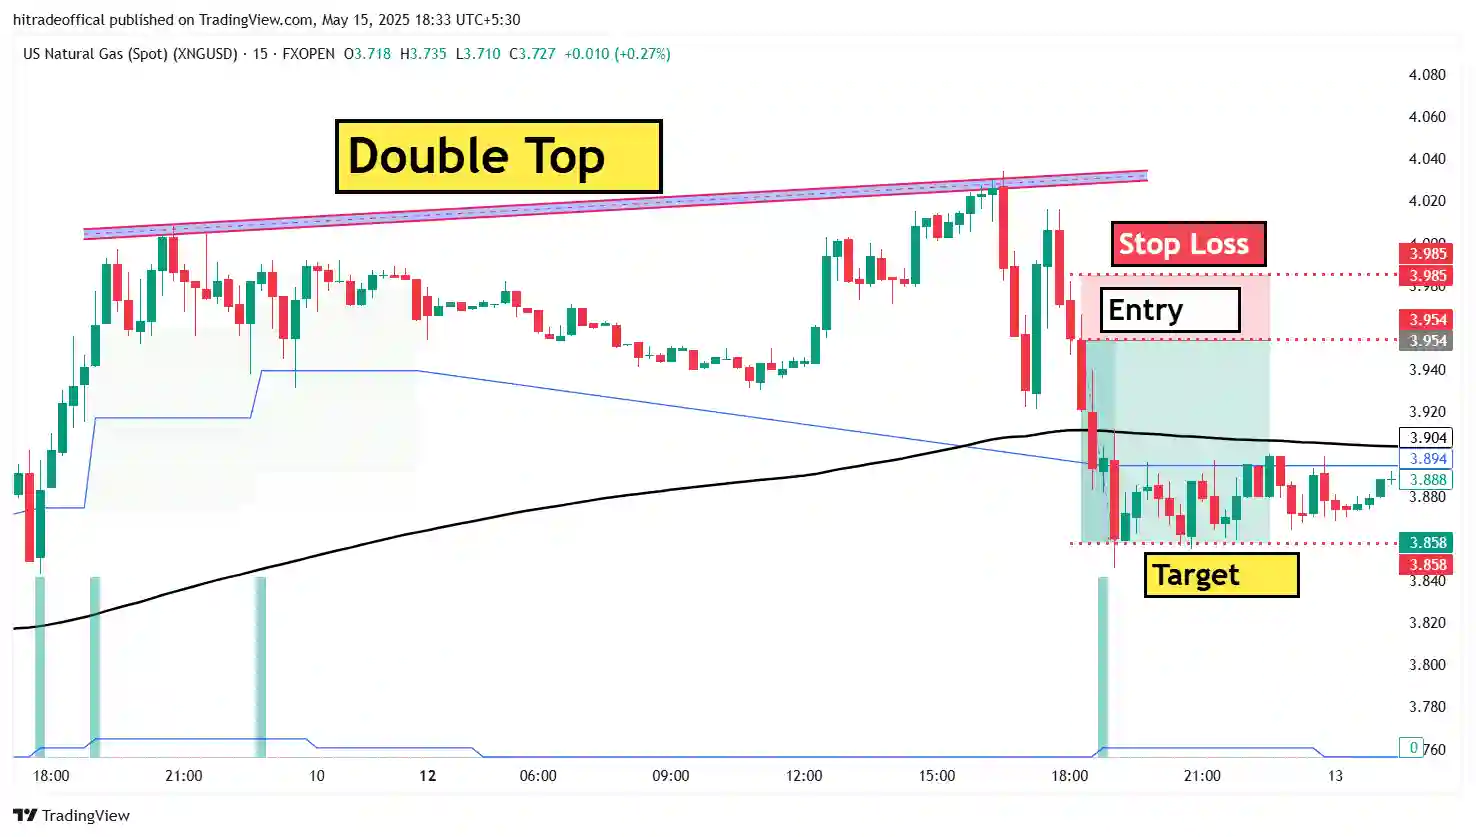
1. Identifying the False Breakout
- The price initially breaks above the resistance level (yellow zone) but quickly reverses.
- A strong bearish candlestick confirms the breakout failure.
- This is a classic example of a false breakout that traps early buyers.
2. Entry Point
- Once the price returns within the range after the false breakout, traders can look for an entry.
- The best entry is when price re-tests the support zone (previous resistance) and forms a confirmation candle.
3. Stop-Loss Placement
- Stop-loss should be placed below the previous swing low (marked in red on the chart).
- This minimizes risk while allowing some price fluctuations.
4. Take-Profit Target
- The target should be set at the next major resistance level.
- In this case, the target is near the upper resistance zone, ensuring a good risk-to-reward ratio.
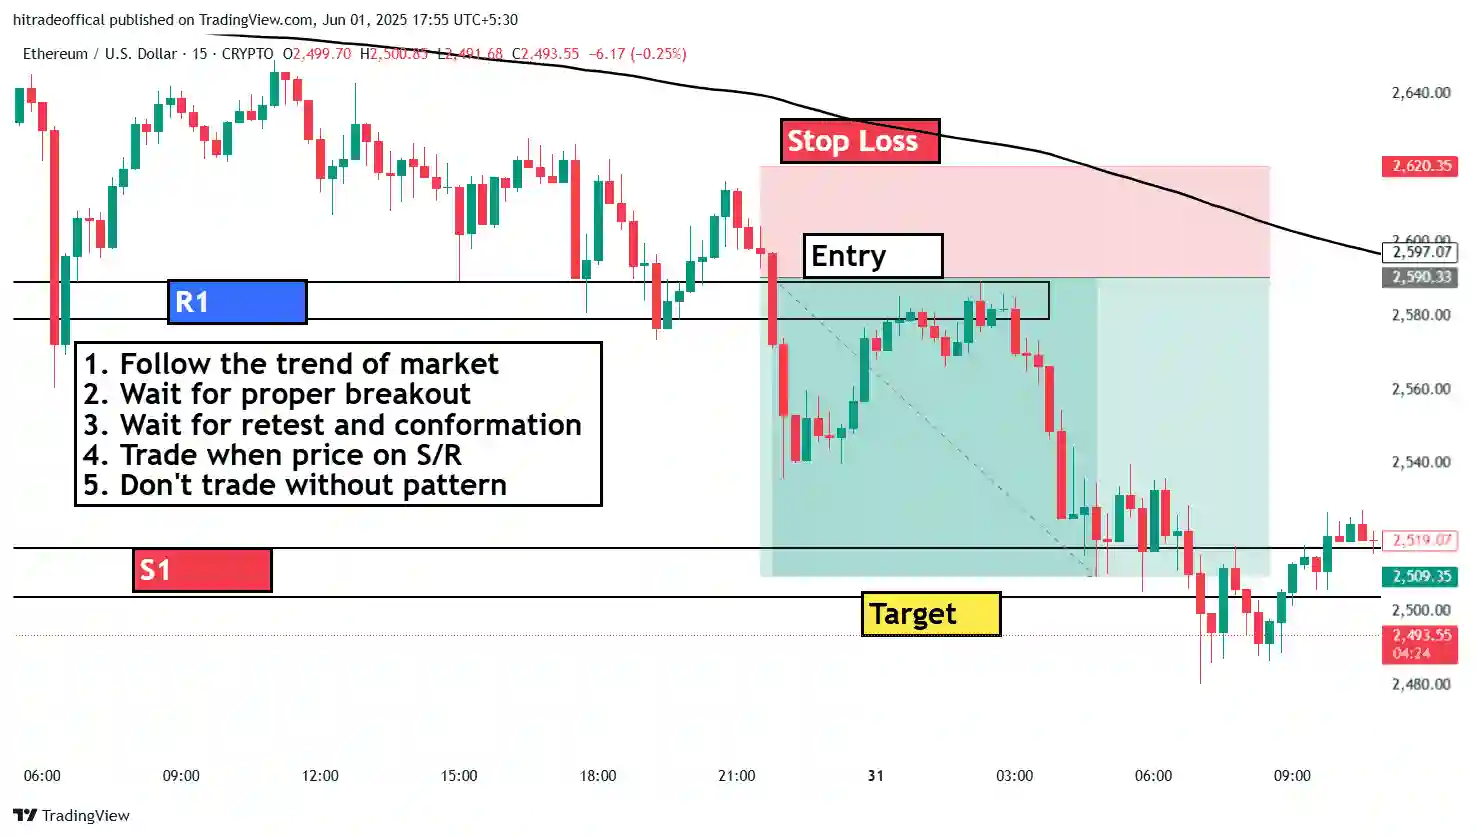
How to Trade False Breakouts Successfully?
Trading false breakouts requires a structured approach. Here’s a step-by-step guide to help you trade them effectively:
Step 1: Identify Key Support and Resistance Levels
Before trading false breakouts, you must identify strong support and resistance levels where price is likely to react. Use:
- Daily and Weekly Highs/Lows
- Previous Swing Highs/Lows
- Fibonacci Retracement Levels
- Trendlines and Moving Averages
Step 2: Watch for Breakout and Reversal Signals
Once the price approaches a key level, monitor price action closely. If the breakout happens, look for:
- Reversal Candlestick Patterns: Pin bars, engulfing patterns, and doji candles signal rejection of higher/lower prices.
- Volume Analysis: If a breakout occurs on low volume, it is more likely to fail.
- Divergence: If RSI or MACD shows divergence, the breakout may not be strong.
Step 3: Enter the Trade After Confirmation
Avoid entering too early. Wait for the price to return within the previous range and confirm the breakout failure before placing a trade.
Step 4: Manage Risk Effectively
- Always use a stop-loss to protect your capital.
- Adjust position size based on your risk tolerance.
- Use a trailing stop to lock in profits if the price moves in your favor.
Step 5: Set Realistic Profit Targets
- Don’t expect unrealistic moves.
- Look for the next major support/resistance level for profit booking.
Common Mistakes to Avoid in False Breakout Trading
- Entering too early: Wait for confirmation before entering.
- Ignoring volume: A false breakout often has low volume compared to a real breakout.
- Placing stop-loss too tight: Market noise can stop you out prematurely.
- Not following the trend: False breakouts are more reliable when trading in the direction of the overall trend.
- Lack of Patience: Rushing into trades without confirmation leads to unnecessary losses.
- Not Backtesting the Strategy: Always test your strategy on historical charts before trading live.
Question & Answer Section
Q1: How do I differentiate between a real and a false breakout? A: A real breakout shows strong momentum, increased volume, and sustained price movement beyond the breakout level. A false breakout, in contrast, reverses quickly and lacks follow-through.
Q2: What are the best indicators to confirm a false breakout? A: Moving averages, RSI divergence, and volume analysis can help confirm false breakouts.
Q3: Can false breakouts be used for intraday trading? A: Yes, false breakout strategies are effective in intraday trading, especially in volatile markets like crude oil, forex, and indices.
Q4: Is this strategy suitable for beginners? A: Yes, but beginners should first practice on a demo account to understand how false breakouts behave before trading with real money.
Q5: What is the best market to trade false breakouts? A: Forex, commodities (crude oil, gold), and stock indices are great for false breakout trading due to their volatility.
Q6: Should I use leverage when trading false breakouts? A: Leverage can amplify both profits and losses. Use it cautiously and apply proper risk management.
Advanced False Breakout Trading Techniques
1. Combining False Breakouts with Fibonacci Levels
Using Fibonacci retracement levels can help validate false breakouts. If a false breakout occurs near the 61.8% retracement level, it strengthens the setup.
2. Using Multi-Timeframe Analysis
- Check higher timeframes (H1, H4, Daily) for trend direction.
- Enter trades on lower timeframes (M15, M30) after confirmation.
3. Order Flow and Market Depth Analysis
- Use Level 2 data to see real buy and sell orders.
- If there’s no strong buying interest after a breakout, it may be false.
Conclusion
False breakout trading is a powerful strategy that helps traders avoid traps and make profitable trades with low risk. By following the right approach—waiting for confirmation, placing stop-loss correctly, and setting realistic targets—you can significantly improve your trading performance.
Trending Tags: #FalseBreakout #TradingStrategy #StockMarket #Forex #PriceAction #CrudeOil #RiskManagement #TradingTips #TechnicalAnalysis