Introduction Gold (XAU/USD) has always been a popular asset for traders due to its stability, liquidity, and ability to act as a hedge against inflation. Traders often utilize technical analysis to determine potential trade opportunities. This article will dive deep into a trading strategy using paper trading and backtesting methods, leveraging the insights from the provided chart.
For more insights on trading strategies, visit Investopedia and TradingView. Also, check out our website for expert market analysis at HiTrade Official.
What is Paper Trading & Backtesting?
Paper Trading
Paper trading is a method where traders execute trades in a simulated environment without risking real money. This allows traders to test strategies, understand market dynamics, and build confidence before engaging in live trading. Many brokers offer demo accounts that simulate real market conditions, allowing traders to practice risk-free.
Check out ThinkorSwim by TD Ameritrade for an excellent paper trading platform. For more insights, visit HiTrade Official.
Backtesting
Backtesting involves applying a trading strategy to historical data to assess its effectiveness. By analyzing past price movements, traders can evaluate whether a strategy would have been profitable in real market conditions. The key aspects of backtesting include:
- Historical Price Data Analysis
- Performance Metrics Evaluation
- Risk Management Considerations
- Optimization for Future Trades
For automated backtesting tools, visit MetaTrader 4/5. Read more about advanced trading techniques on HiTrade Official.
Understanding the Chart: Key Trading Concepts
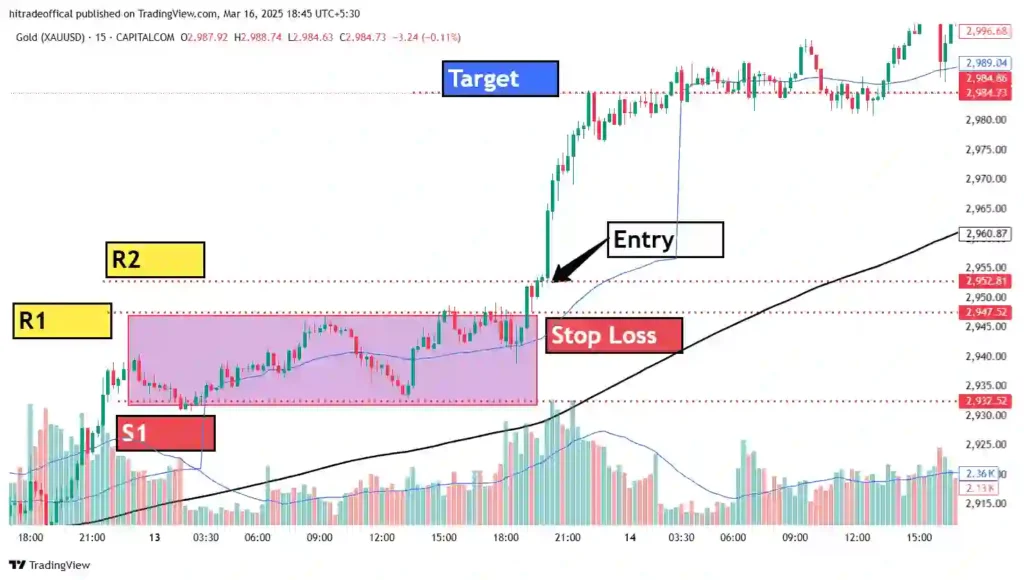
The provided chart illustrates a gold (XAU/USD) trading setup on a 15-minute timeframe with the following key technical patterns:
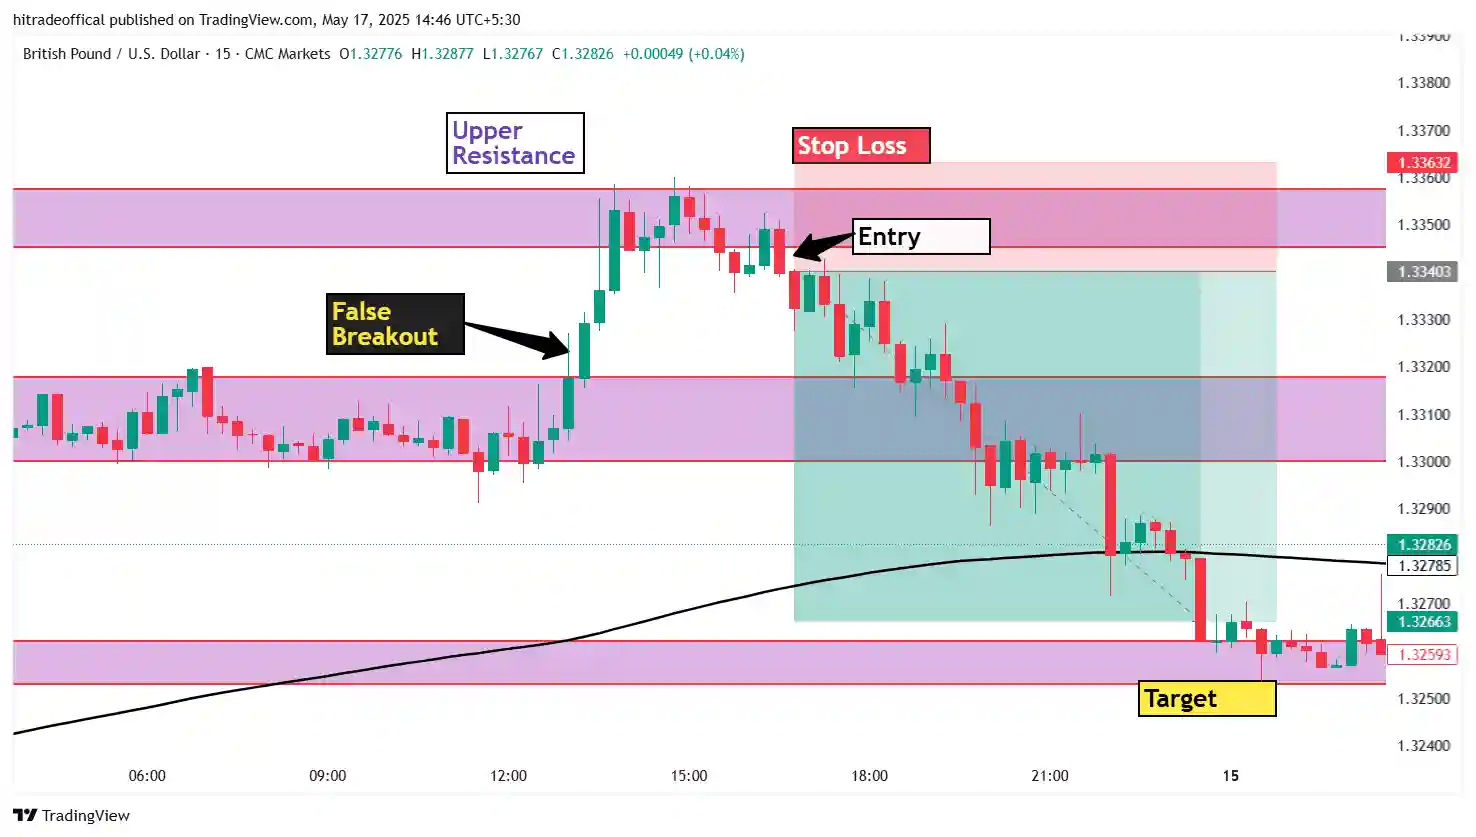
1. Box Consolidation
A phase where the price moves within a range, indicating market indecision. Traders should look for:
- A clearly defined support and resistance zone.
- Low trading volume, reflecting reduced market participation.
- Multiple rejections at the support and resistance levels, confirming consolidation.
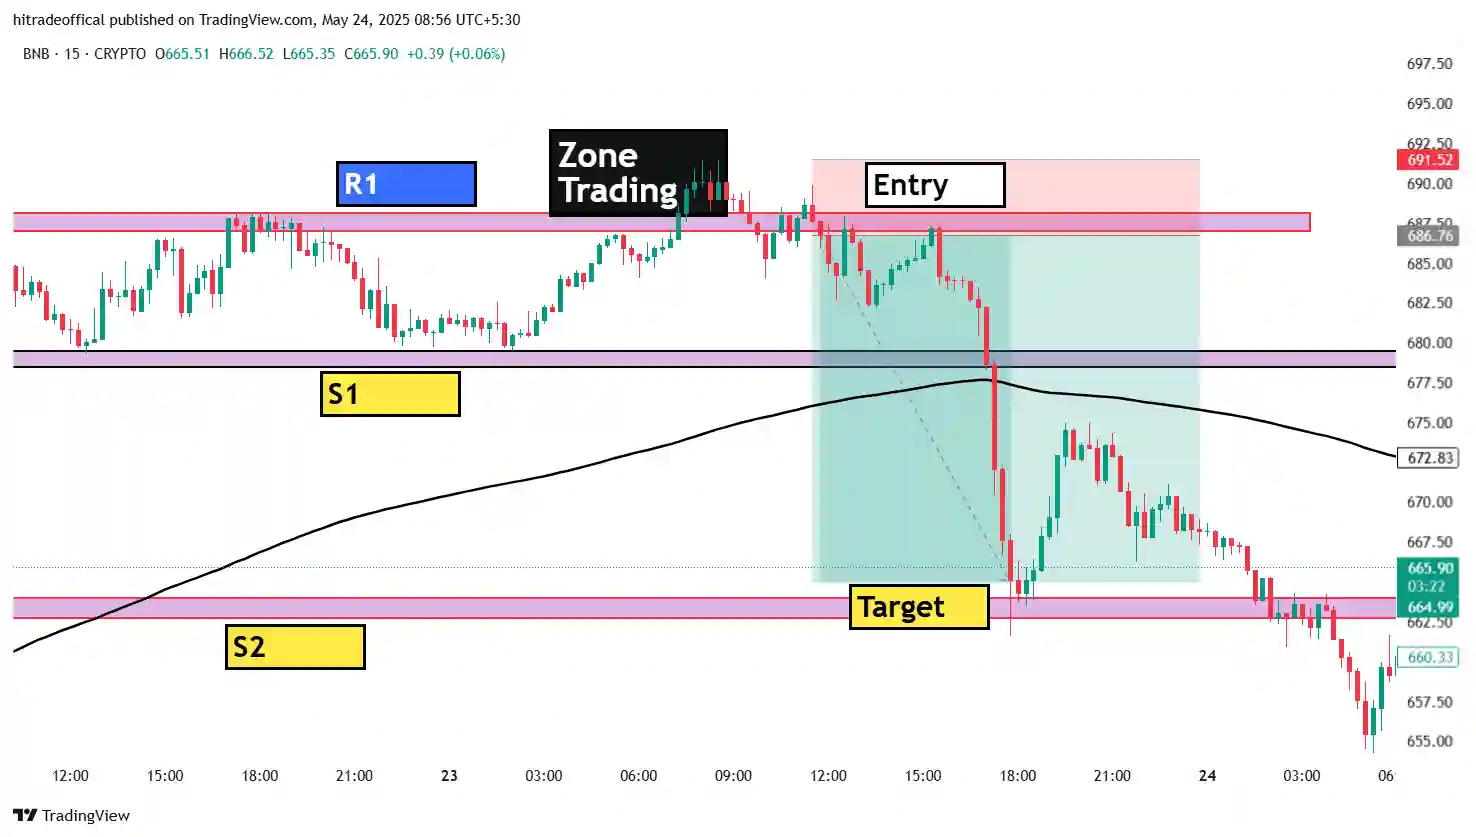
2. Support & Resistance Levels
- S1 (Support Level 1) – A key price level where demand increases, preventing further declines.
- R1 & R2 (Resistance Levels 1 & 2) – Price levels where selling pressure increases, capping further upward movement.
3. Breakout Confirmation
A breakout occurs when the price moves above the consolidation zone, signaling a bullish trend. This should be accompanied by:
- Increased volume to validate the breakout.
- Strong bullish candlesticks, such as an engulfing pattern.
- A successful retest of the broken resistance level as new support.
For further reading, visit BabyPips Trading School. Check out our gold trading insights at HiTrade Official.
4. Moving Averages & Volume Analysis
- 50-day and 200-day Moving Averages (MAs) help confirm trend direction.
- Volume spikes indicate strong participation and market interest in the breakout.
Step-by-Step Gold Trading Strategy (Using Paper Trading & Backtesting)
Step 1: Identify the Consolidation Phase
- When the price moves sideways within a defined range, it indicates consolidation.
- Observe decreasing volume, signaling lower market participation.
- Mark support and resistance levels to prepare for potential breakouts.
Step 2: Recognizing the Breakout Signal
- A breakout occurs when the price moves above the resistance level (R1/R2) with increased volume.
- Look for candlestick patterns like bullish engulfing or large green candles confirming strong momentum.
- Ensure the breakout is backed by higher volume to avoid false signals.
Step 3: Entry & Stop-Loss Placement
- Entry Point: After a successful breakout, enter a long position once the price retests the resistance level (now acting as support).
- Stop-Loss Placement: Set a stop-loss below the previous consolidation zone or the moving average to manage risk.
- Risk-Reward Ratio: Maintain a 1:2 or 1:3 risk-reward ratio to maximize potential profits.
Step 4: Setting Profit Targets
- The first target should be at R2 (next resistance level).
- If the bullish momentum continues, trail the stop-loss to lock in profits.
- Utilize moving averages (50MA & 200MA) to identify trend continuation or reversal signals.
For more trading tools, explore TradingView’s Strategy Tester. Visit our trading strategies section at HiTrade Official.
Common Mistakes in Paper Trading & Backtesting
1. Ignoring Volume Confirmation
A breakout without strong volume often leads to false signals. Always ensure that volume supports the move before entering trades.
2. Not Using Stop-Loss
Risk management is crucial to prevent significant losses. Without a stop-loss, a single bad trade can wipe out weeks of profits.
3. Over-Optimizing Strategies
Back-testing should not be tweaked excessively to fit past data. The market is ever-changing, and a strategy that works on historical data might not work in the future.
4. Emotional Trading
Paper trading builds discipline but should be transitioned into real trading gradually. Traders often get overconfident with simulated success and fail to consider emotions in live trading.
Conclusion
Trading gold using technical analysis requires a disciplined approach, which can be refined through paper trading and back-testing. By identifying consolidation zones, breakouts, and key support/resistance levels, traders can enhance their strategies before risking capital in live markets.
Would you like to see more case studies on trading strategies? Let us know in the comments! 🚀 For the latest trading updates, visit HiTrade Official.
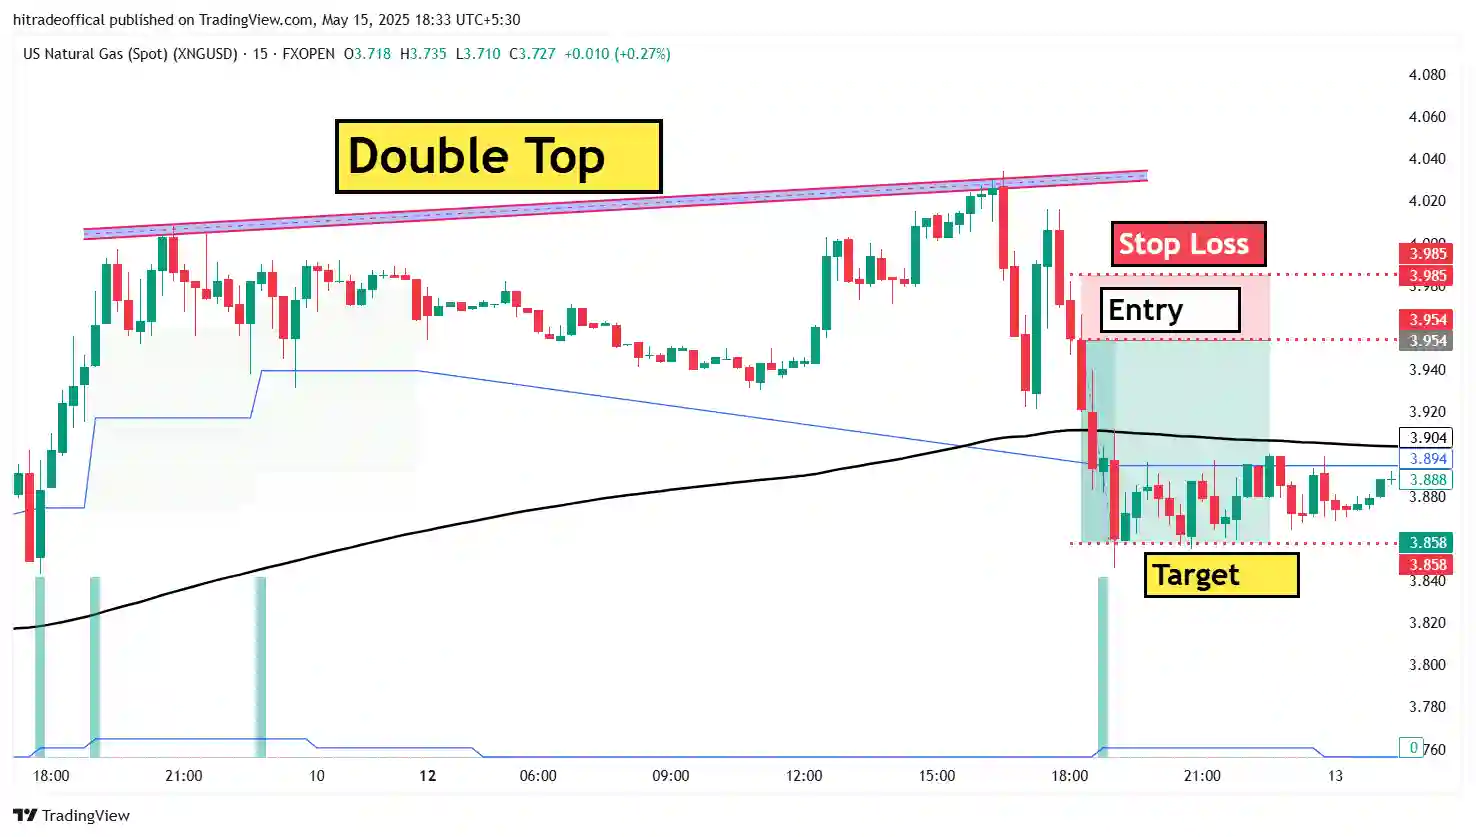
Gold Trading Strategy: Entry, Stop Loss & Target Explained
Introduction Gold (XAU/USD) trading is a favorite among traders due to its high liquidity and strong market trends. Understanding the correct entry point, stop-loss, and target levels is essential for a successful trade. This article breaks down these key trading components using the provided gold chart.
For more trading strategies, visit HiTrade Official and Stock Bharti.
Understanding the Trade Setup
The provided chart shows a structured trade setup, including a breakout entry, stop-loss placement, and profit target.
Why Gold Trading is Popular?
- Gold is a safe-haven asset.
- High volatility provides trading opportunities.
- It follows technical levels effectively.
- Strong correlation with USD and inflation trends.
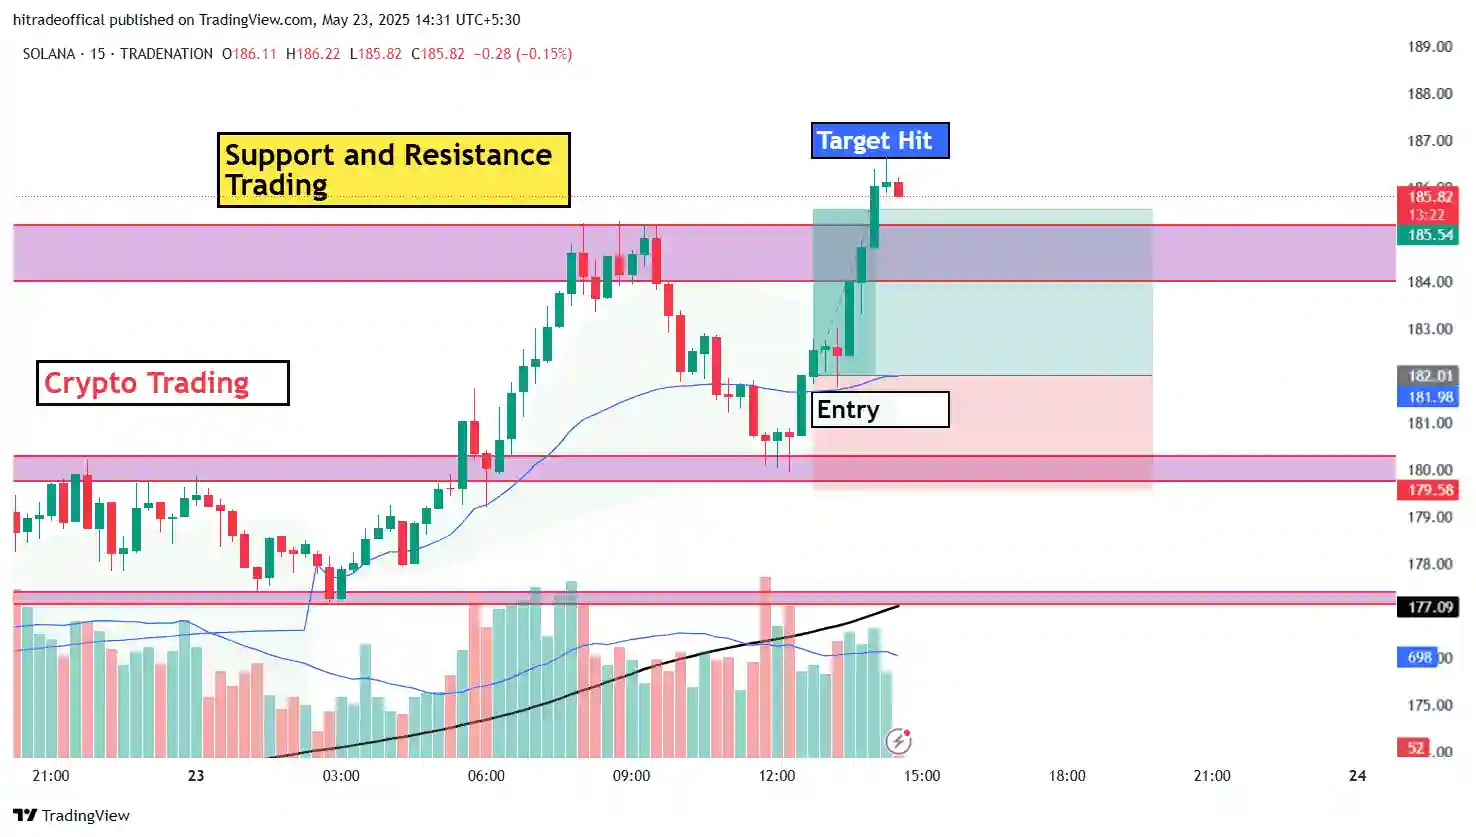
What is an Entry Point in Trading?
An entry point is the price level where a trader initiates a position. A well-planned entry ensures better risk-reward potential and minimizes losses.
Entry Confirmation Factors:
- Breakout above the consolidation zone (purple box)
- Increase in volume during breakout
- Moving average confirmation
- Retest of resistance as support
In the chart, the entry point is marked just above R1 (Resistance 1) after price breaks out and confirms upward momentum.
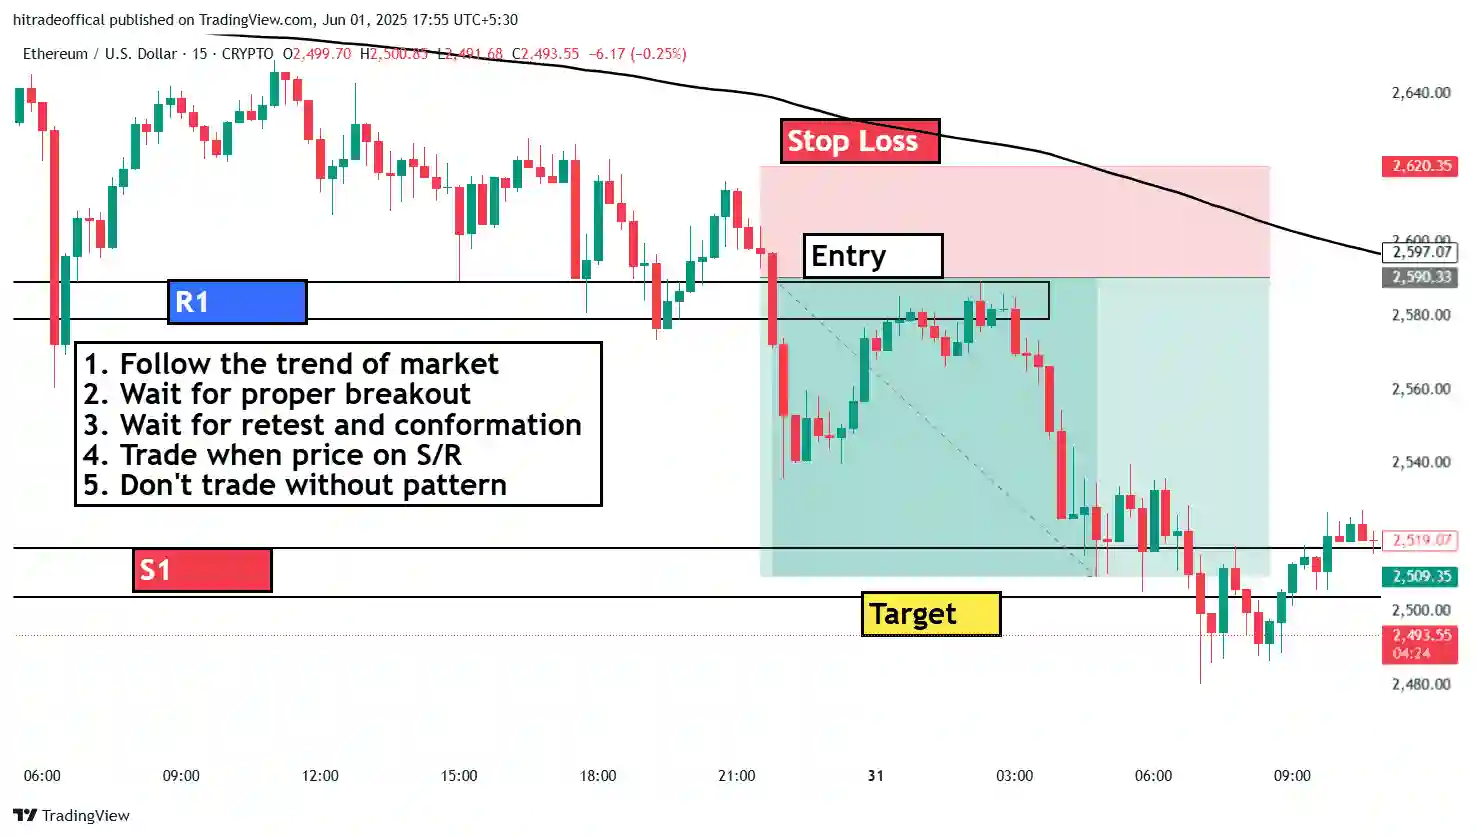
What is a Stop-Loss in Trading?
A stop-loss is a predetermined price level where a trader exits the trade to minimize losses. It is a crucial risk management tool.
Stop-Loss Placement Strategies:
- Below the recent support level (S1)
- Below the moving average (black line)
- Using ATR (Average True Range) to determine volatility-based stop-loss
In the provided chart, the stop-loss is set slightly below the breakout level to protect against false breakouts.
How to Set a Target in Gold Trading?
A target (take-profit level) is the price point where a trader exits with a profit. It should be based on technical analysis and key resistance levels.
Target Calculation Techniques:
- Using Resistance 2 (R2) as a target level
- Risk-reward ratio (1:2 or higher)
- Fibonacci extensions to estimate potential profit levels
The provided chart highlights the target at a higher resistance level, ensuring a good profit margin.
Risk-Reward Ratio in Gold Trading
A proper risk-reward ratio is necessary for a profitable strategy. Common ratios include:
- 1:2 – Risking $1 to gain $2 (balanced strategy)
- 1:3 – More aggressive with higher profit potential
- 1:1 – Less favorable but used in scalping strategies
Common Mistakes Traders Make in Gold Trading
- Entering trades without confirmation signals
- Placing stop-loss too close to the entry
- Ignoring fundamental factors affecting gold prices
- Overleveraging, leading to unnecessary risks
Key Takeaways for Gold Traders
- Entry: Wait for a confirmed breakout with volume support.
- Stop-Loss: Place below the last support level to manage risk.
- Target: Use resistance zones and technical tools for profit booking.
By applying this strategy in paper trading and back-testing, traders can refine their skills before live trading. For more insights, visit HiTrade Official. 🚀
Top 10 Most Common Trading Questions & Answers
Gold trading is highly popular in the USA, Canada, and other global markets. Below are the top 10 frequently asked questions related to gold trading, price action, and technical analysis.
1. What is the best time to trade gold (XAU/USD)?
Gold is most volatile during the New York and London trading sessions. The best time to trade is between 8:00 AM – 12:00 PM EST, when liquidity and price movements are highest.
2. How do I identify the best entry point in gold trading?
A good entry point occurs when:
- The price breaks out of a consolidation zone.
- There is a high trading volume confirming the breakout.
- Support and resistance levels are respected.
Traders often use technical indicators like Moving Averages, RSI, and Fibonacci retracements to confirm the entry point.
3. What is the safest stop-loss strategy for gold trading?
A stop-loss should be placed below a strong support level to protect against losses. Common stop-loss strategies include:
- Support-based stop-loss (below S1 level).
- ATR (Average True Range) based stop-loss for volatility adjustment.
- Trailing stop-loss to lock in profits as the trade moves in favor.
4. How do I set profit targets in gold trading?
A profit target should be based on technical resistance levels. Some common methods include:
- Using Resistance 1 (R1) or Resistance 2 (R2) levels.
- Applying Fibonacci extensions for projected price movements.
- Risk-to-reward ratio method (1:2 or higher).
5. What is the best trading strategy for gold scalping?
Scalping gold requires quick entries and exits. The best strategy includes:
- Using a 5-minute or 15-minute chart.
- Trading breakouts and pullbacks.
- Utilizing volume confirmation and price action signals.
6. Is gold trading profitable for beginners?
Yes, but beginners should start with paper trading and backtesting strategies before investing real money. Also, risk management is crucial to avoid large losses.
7. What indicators work best for trading gold?
The best indicators for gold trading include:
- Moving Averages (50 EMA, 200 EMA) – Identify trends.
- RSI (Relative Strength Index) – Spot overbought and oversold conditions.
- Bollinger Bands – Detect volatility and price breakouts.
8. How much capital is needed to start trading gold?
- With a forex broker, traders can start with as little as $100-$500 using leverage.
- For spot gold trading, capital of at least $1,000+ is recommended.
Always use proper risk management and never risk more than 1-2% of your account per trade.
9. What is the difference between gold futures and spot gold trading?
- Spot Gold (XAU/USD): Immediate buying/selling of gold at market price.
- Gold Futures: Contracts to buy/sell gold at a future date, often requiring margin.
Spot gold is preferred by short-term traders, while futures are used for hedging and speculation.
10. How can I improve my gold trading skills?
To become a better trader, focus on:
- Practicing with a demo account before using real money.
- Learning technical analysis and chart reading.
- Following market news and economic data that impact gold prices.
- Backtesting trading strategies to find what works best.
For more trading insights, visit HiTrade Official and Stock Bharti. 🚀
Top 5 Backtesting Questions & Answers for Traders
Backtesting is an essential part of developing a profitable trading strategy. Below are the most frequently asked questions about backtesting in gold trading, forex, and stock markets.
1. What is backtesting in trading, and why is it important?
Backtesting is the process of testing a trading strategy using historical data to see how it would have performed in the past. It is important because:
- Helps in identifying profitable strategies.
- Reduces trading risks by avoiding untested methods.
- Builds confidence before using real money.
A well-tested strategy improves a trader’s chances of success in the live market.
2. What are the best tools/software for backtesting?
Traders use different platforms to backtest their strategies. The most popular tools include:
- TradingView – Ideal for manual backtesting with indicators.
- MetaTrader 4 & 5 (MT4/MT5) – Supports automated backtesting.
- Python & Excel – Used by quantitative traders for strategy testing.
Choosing the right tool depends on your trading style and strategy complexity.
3. How do I know if my backtest results are reliable?
To ensure reliability, check these key factors:
- Sufficient historical data: Test over multiple years and market conditions.
- Low drawdown: A strategy should survive market crashes.
- Realistic trading costs: Include spreads, slippage, and commissions.
A profitable backtest does not guarantee future success, but it improves the odds.
4. How many trades should I backtest before trusting a strategy?
A good backtest should include at least 100-500 trades to be statistically valid. More trades help to:
- Identify performance consistency.
- Reduce the impact of random market movements.
- Improve risk-reward and probability analysis.
A small number of trades can lead to misleading results, so test across different timeframes and market conditions.
5. What are the biggest mistakes traders make in backtesting?
Many traders make errors that lead to inaccurate backtest results. The most common mistakes include:
- Overfitting: Optimizing a strategy too much for past data but failing in live trading.
- Ignoring trading costs: Not accounting for spreads, slippage, and fees.
- Small sample size: Testing on too few trades or a short time period.
- Curve fitting: Selecting parameters that only work on historical data but fail in real-time.
To avoid these mistakes, always backtest under realistic market conditions.
By mastering backtesting techniques, traders can increase their profitability and reduce risks in live markets.
For more trading strategies, visit HiTrade Official and Stock Bharti 🚀