Understanding USOIL Price Consolidation & Key Levels
USOIL (WTI Crude Oil) experiences price consolidation when the market moves sideways within a specific range, indicating indecision between buyers and sellers. Traders closely monitor support and resistance zones during consolidation to identify potential breakout or breakdown opportunities.
What is Price Consolidation?
Price consolidation occurs when crude oil prices trade within a narrow range without a clear trend. This often happens before a major price movement, making it a crucial phase for traders.
Key Levels in USOIL Trading
- Support Levels: The price zones where buying interest is strong enough to prevent further decline.
- Resistance Levels: The price zones where selling pressure prevents further upward movement.
- Breakout Points: When the price moves beyond the consolidation range, signaling a potential trend shift.
How to Trade Price Consolidation?
- Identify the Range: Use technical indicators like moving averages and Bollinger Bands to spot consolidation.
- Wait for a Breakout: A strong breakout above resistance or breakdown below support confirms the next move.
- Use Volume Analysis: A breakout with high trading volume increases reliability.
For more in-depth analysis and trading strategies, check out HiTradeOfficial and explore real-time crude oil market updates on Investing.com.
Identifying Support Zones: B1, B2, and B3 Breakdown
In USOIL trading, support zones are crucial levels where buying pressure prevents the price from falling further. These levels are identified based on historical price action and technical indicators. In the first image, we can see three key support levels: B1, B2, and B3, which played a significant role in the price movement.
Breakdown of Support Zones (B1, B2, and B3)
The support levels in the first image are as follows:
- B1 (First Support Zone): Around 66.94 – The price first tested this level, showing initial buying interest.
- B2 (Second Support Zone): Around 66.80 – Price retested this zone, forming a double-bottom pattern, which often signals a reversal.
- B3 (Final Support Zone): Around 66.40 – A strong reaction occurred here, leading to a sharp bullish move, confirming strong demand.
How to Identify Strong Support Zones?
- Look for Historical Price Reactions – If a level has been tested multiple times, it’s likely a strong support.
- Use Volume Analysis – High volume near support zones confirms buying interest.
- Watch for Bullish Candlestick Patterns – Pin bars, engulfing candles, or double-bottom formations indicate potential reversals.
Trading Strategy Based on Support Zones
- Buying Opportunity: Enter trades near support zones with confirmation from technical indicators like EMA (Exponential Moving Average) and RSI (Relative Strength Index).
- Stop Loss: Place stop-loss orders just below the support zone to manage risk.
- Take Profit: Target previous resistance levels to maximize profits.
For more detailed trading insights, visit HiTradeOfficial and check out Investopedia to learn more about support and resistance strategies.
Resistance Areas and Their Impact on Price Movements
Resistance levels are key price zones where selling pressure increases, preventing further upward movement. These levels are crucial in USOIL trading as they determine potential reversal points and breakout opportunities.
What is a Resistance Area?
A resistance zone is a price level where crude oil struggles to move higher due to increased selling pressure. These areas often align with previous highs and can be identified using technical indicators like moving averages, trendlines, and Fibonacci retracement levels.
Impact of Resistance on Price Movements
- Price Reversals – When the price approaches a resistance zone, sellers may step in, pushing the price downward.
- Breakouts – If buying pressure is strong enough, the price may break above resistance, leading to a bullish rally.
- False Breakouts – Sometimes, price temporarily breaches resistance but fails to hold, trapping traders in losing positions.
How to Identify Strong Resistance Zones?
- Previous Highs – If a price level has rejected multiple times, it’s a strong resistance.
- Volume Analysis – A breakout with high volume confirms strong buying interest.
- Moving Averages – The 200-day SMA and 50-day EMA often act as dynamic resistance levels.
Trading Strategies for Resistance Levels
- Sell Near Resistance – If the price struggles to break above, short positions can be considered.
- Wait for Breakout Confirmation – A strong breakout with volume can signal a long trade opportunity.
- Use Stop-Loss Orders – Place stop losses slightly above resistance to manage risk.
For more technical insights, visit HiTradeOfficial and explore detailed market analysis on Investing.com.
Breakout Strategy: How to Trade USOIL Reversals
A breakout strategy is one of the most effective ways to trade USOIL reversals. Breakouts occur when the price moves beyond a key support or resistance level, indicating a potential shift in market direction. Traders use these breakouts to catch strong price movements early and maximize profits.
How to Identify a Breakout in USOIL?
- Watch for Consolidation – Before a breakout, the price often moves in a tight range.
- Monitor Key Levels – Breakouts typically occur at support and resistance zones (identified in previous sections).
- Look for High Volume – A strong breakout should be supported by rising trading volume, confirming institutional participation.
Types of Breakouts in USOIL Trading
✅ Bullish Breakout: When price breaks above a resistance zone, signaling an uptrend.
✅ Bearish Breakout: When price falls below a support level, indicating a downtrend.
Breakout Trading Strategy for USOIL Reversals
🔹 Step 1: Identify the Breakout Zone – Use technical indicators like EMA (Exponential Moving Average), RSI, and MACD to confirm breakout points.
🔹 Step 2: Wait for Confirmation – A breakout candle closing beyond key levels confirms the move. Avoid trading fake breakouts.
🔹 Step 3: Enter the Trade – Place a buy order after a bullish breakout or sell order after a bearish breakout.
🔹 Step 4: Set Stop-Loss and Target –
- Stop-loss: Just below the breakout zone (bullish) or above (bearish).
- Take profit: At the next key resistance or support level.
Example from USOIL Chart
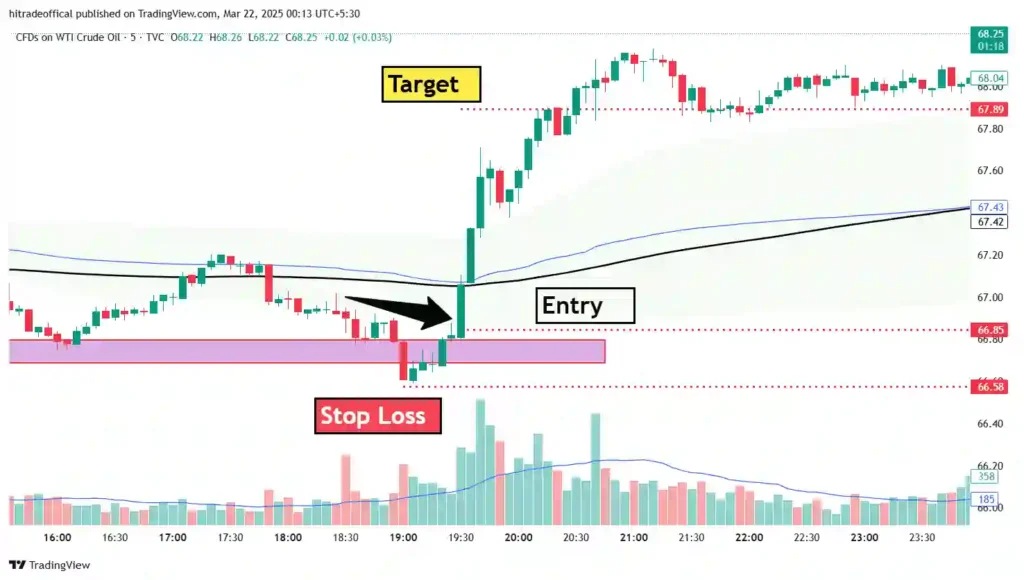
In the second image, we see a strong bullish breakout above resistance, leading to a significant rally. The entry point was identified near $66.85, while the target level was around $67.89, showing a profitable price movement.
Final Thoughts
Trading breakouts in USOIL requires patience, discipline, and technical analysis. For more real-time strategies and analysis, visit HiTradeOfficial. Also, check out Investopedia for a deep dive into breakout trading strategies.
Volume Analysis: What It Tells About Market Sentiment
Volume is a key technical indicator in USOIL trading that helps traders understand market sentiment and confirm price movements. Higher trading volume indicates strong market participation, while lower volume suggests weaker momentum.
Why is Volume Important in Trading?
📌 Confirms Price Trends: If the price rises with high volume, it confirms a strong bullish trend.
📌 Identifies Potential Reversals: A sudden spike in volume at key levels can indicate a trend reversal.
📌 Detects Breakout Strength: A breakout with high volume is more likely to be sustained, while a low-volume breakout may be a false signal.
How to Interpret Volume in USOIL Trading?
- High Volume with Price Increase → Bullish confirmation (Strong buying interest).
- High Volume with Price Drop → Bearish signal (Heavy selling pressure).
- Low Volume with Price Movement → Lack of conviction (Potential reversal or fake breakout).
- Volume Spikes at Support/Resistance → Market participants are reacting to key levels, increasing volatility.
Example from USOIL Chart
In the second image, a sharp volume increase occurred during the breakout, confirming strong bullish momentum. The breakout from the entry zone (around $66.85) was accompanied by a volume surge, reinforcing the price rally toward the target area ($67.89).
Volume-Based Trading Strategies
🔹 Volume Breakout Strategy: Enter trades when price breaks key levels with high volume confirmation.
🔹 Divergence Strategy: If price rises but volume decreases, it signals weakening momentum and possible reversal.
🔹 Volume Climax Analysis: An extremely high-volume candle may indicate the end of a trend, suggesting profit-taking or reversal.
Final Thoughts
Mastering volume analysis enhances trade accuracy and minimizes false signals. For more expert insights, visit HiTradeOfficial and explore Investing.com for real-time market volume data.
Best Trading Strategies for Crude Oil in 2025
Crude oil (USOIL) remains one of the most volatile and profitable commodities for traders. In 2025, market dynamics are shifting due to geopolitical factors, supply-demand imbalances, and macroeconomic trends. To stay ahead, traders must adopt effective strategies tailored to the evolving landscape.
1. Trend Following Strategy
📌 How it Works: Traders follow the dominant market trend using moving averages, RSI, and MACD.
📌 Key Indicators:
- 50-day & 200-day EMA crossover (Golden Cross for bullish, Death Cross for bearish).
- RSI above 50 = bullish momentum, RSI below 50 = bearish momentum.
📌 Example: If crude oil price breaks above its 200-day EMA with strong volume, it signals a long entry.
2. Breakout Trading Strategy
📌 How it Works: Identifies key support and resistance levels and trades breakouts.
📌 Confirmation: A breakout with high volume reduces the chances of a fake breakout.
📌 Example: In the second image, the price broke out from a key entry zone ($66.85), confirming a bullish breakout.
3. Supply & Demand Strategy
📌 How it Works: Monitors crude oil supply (OPEC decisions, US shale production) and global demand (economic growth, industrial activity).
📌 Key Factors:
- OPEC production cuts often cause price surges.
- Increased demand from China or the US strengthens crude oil prices.
📌 Example: If OPEC announces a production cut, crude oil prices often surge due to limited supply.
4. Scalping & Intraday Strategy
📌 How it Works: Short-term trades targeting quick price movements, using 5-minute and 15-minute charts.
📌 Key Tools:
- Bollinger Bands to detect overbought/oversold conditions.
- VWAP (Volume Weighted Average Price) for identifying institutional buying zones.
📌 Example: Scalpers enter trades when price touches the lower Bollinger Band with increasing volume.
5. Fundamental & News-Based Trading
📌 How it Works: Uses economic reports, geopolitical news, and inventory data to predict price moves.
📌 Key Reports:
- EIA Crude Oil Inventory Report (Every Wednesday)
- US Federal Reserve Interest Rate Decisions
📌 Example: A larger-than-expected drop in US crude oil inventories often triggers a price spike.
Final Thoughts
Adapting to market trends with technical and fundamental strategies ensures higher success rates in crude oil trading. Stay updated with market analysis on HiTradeOfficial and get live crude oil data from OilPrice.com.
Mastering USOIL Trading: Entry, Stop Loss & Target Explained
How to Identify the Perfect Entry Point in USOIL Trading
Finding the perfect entry point in USOIL trading is crucial for maximizing profits and minimizing risks. Whether you’re a day trader or a swing trader, using a combination of technical indicators, support & resistance levels, and volume analysis can help you make more accurate entries.
1. Using Support and Resistance Levels
📌 How it Works: Traders look for price zones where USOIL has historically reversed or consolidated.
📌 Key Levels to Watch:
- Support Zone: A price level where buying interest is strong, preventing further decline.
- Resistance Zone: A price level where selling pressure increases, limiting upward movement.
📌 Example from Image 1: - B1, B2, and B3 represent key support zones where the price found buying interest before reversing.
- The pink consolidation zone shows a crucial resistance area before the breakout.
🔹 Pro Tip: Enter long trades near support and short trades near resistance to improve risk-reward ratios.
2. Trend Confirmation with Moving Averages
📌 How it Works: Moving averages help smooth price action and identify the market trend.
📌 Key Moving Averages for USOIL:
- 50-day EMA (Short-term trend indicator)
- 200-day SMA (Long-term trend indicator)
📌 Entry Signals: - Bullish Entry: When the 50 EMA crosses above the 200 SMA, it signals a strong uptrend.
- Bearish Entry: When the 50 EMA crosses below the 200 SMA, it confirms a downtrend.
🔹 Example from Image 2: The price surged above the moving averages, confirming an ideal entry point for a long trade.
3. Volume Confirmation for Strong Entries
📌 Why Volume Matters?
- High volume during a price move confirms the strength of the trend.
- Low volume near key levels signals weak momentum and potential reversals.
📌 Entry Signal with Volume: - Breakout with high volume → Strong entry signal.
- Breakout with low volume → Possible fakeout, avoid entry.
🔹 Example from Image 2: The sharp price breakout from the entry zone ($66.85) was backed by increasing volume, confirming a strong buy entry.
4. Candlestick Patterns for Entry Confirmation
📌 How it Works: Candlestick formations provide visual clues for potential market reversals or trend continuations.
📌 Key Entry Patterns:
- Bullish Engulfing (Strong buy signal near support).
- Hammer & Doji (Reversal patterns at key levels).
- Bearish Engulfing (Strong sell signal near resistance).
🔹 Pro Tip: Always wait for a confirmation candle after a pattern appears before entering a trade.
5. Risk Management: Setting Stop Loss & Take Profit
📌 How to Secure Your Entries?
- Stop Loss: Below support for long trades, above resistance for short trades.
- Take Profit: Based on key resistance or support areas.
📌 Example from Image 2: - Stop Loss was placed near $66.58 (below the support zone).
- Target was set at $67.89, a previous resistance level.
Final Thoughts
Mastering entry points in USOIL trading requires technical analysis, volume confirmation, and risk management. Always back-test your strategy before live trading.
For more insights, visit HiTradeOfficial and check Investing.com for live crude oil market analysis. 🚀
The Importance of Setting a Stop Loss for Risk Management
Stop loss is a crucial tool in trading that helps protect your capital from excessive losses. Whether you are trading USOIL or any other financial instrument, implementing a stop loss ensures that you manage risk effectively and stay disciplined in volatile market conditions.
Why is Stop Loss Important in USOIL Trading?
USOIL is known for its high volatility due to global geopolitical events, supply-demand shifts, and economic reports. Without a stop loss, traders expose themselves to unlimited risk, which can lead to significant financial losses. A well-placed stop loss prevents emotions from dictating trade decisions and allows traders to exit losing positions before they worsen.
Types of Stop Loss Orders
- Fixed Stop Loss: A predetermined price level at which the trade will automatically close.
- Trailing Stop Loss: Moves with the market in favor of the trade, locking in profits while minimizing risk.
- Volatility-Based Stop Loss: Adjusts according to market volatility using indicators like the Average True Range (ATR).
How to Place an Effective Stop Loss in USOIL Trading
1. Support and Resistance Method: Place the stop loss below support for buy trades and above resistance for sell trades.
2. ATR Method: Use the Average True Range indicator to calculate stop-loss distance based on recent price movements.
3. Percentage-Based Stop: Set a stop loss based on a percentage of your total capital to control risk exposure.
Example from USOIL Chart
In the second image, the entry was at $66.85, and a stop loss was placed just below $66.58, a key support level. This setup provided a good risk-reward ratio, allowing the trader to manage risk while aiming for higher profits.
Final Thoughts
Setting a stop loss is essential for long-term trading success. It protects your capital, enforces discipline, and ensures that losses are controlled. To enhance your trading strategy, visit HiTradeOfficial and check out Investopedia for more insights on stop-loss techniques.
Understanding Target Levels for Maximum Profit Potential
Setting the right target levels in USOIL trading is essential for maximizing profits while maintaining a solid risk-reward ratio. A well-defined exit strategy helps traders secure gains without letting emotions dictate their decisions.
Why Are Target Levels Important?
- Ensure consistent profit-taking and avoid unnecessary risk.
- Help maintain a disciplined trading approach by locking in gains at predefined levels.
- Prevent greed-based trading, where traders hold positions too long and lose potential profits.
How to Identify the Best Target Levels?
1. Using Support and Resistance
- Previous resistance levels act as potential targets in an uptrend.
- Previous support levels serve as targets in a downtrend.
- Example: In the second image, the price broke above $66.85, making the next resistance zone $67.89 an ideal target.
2. Fibonacci Retracement Levels
- Used to identify potential price reversal points.
- Common target levels: 38.2%, 50%, and 61.8% retracement levels.
- Example: If USOIL is in an uptrend, the 61.8% Fibonacci level can be an optimal target for taking profits.
3. ATR (Average True Range) for Dynamic Targets
- Measures market volatility to determine realistic profit targets.
- Example: If the ATR is 1.5 points, setting a profit target 1.5x ATR above entry ensures a rational price move.
Risk-Reward Ratio: Balancing Profit and Protection
- Minimum recommended risk-reward ratio: 1:2 (risking $1 to make $2).
- Higher reward trades (1:3 or 1:4) ensure long-term profitability.
- Example from Image 2: A stop loss was set at $66.58, while a profit target was placed at $67.89, maintaining a strong risk-reward balance.
Final Thoughts
Understanding and setting accurate target levels is key to successful USOIL trading. By using support & resistance, Fibonacci retracements, and ATR-based targets, traders can lock in profits efficiently.
For in-depth market analysis, visit HiTradeOfficial and check Investing.com for live crude oil price updates and technical analysis.
Analyzing Market Trends to Optimize Entry and Exit Points
Successful USOIL trading depends on identifying market trends and using them to determine the best entry and exit points. By understanding trend direction, momentum, and key price levels, traders can improve their decision-making and maximize profits.
Why Market Trend Analysis is Crucial?
- Helps traders align with the dominant trend instead of trading against it.
- Reduces false signals by filtering out unnecessary trades in choppy markets.
- Enhances entry precision by confirming trend continuation or reversal signals.
How to Identify Market Trends?
1. Moving Averages for Trend Confirmation
- 50-day EMA and 200-day SMA are commonly used for trend analysis.
- Bullish Trend: Price above both moving averages, indicating strong upward momentum.
- Bearish Trend: Price below moving averages, signaling a downward trend.
- Example: In the second image, the price moving above the 50-day EMA suggests a bullish continuation, making it an optimal entry point.
2. Trendline Analysis for Strong Entry & Exit
- Draw trendlines connecting higher lows in an uptrend and lower highs in a downtrend.
- Breakouts above trendlines confirm buy signals, while breakdowns suggest sell signals.
- Example: A breakout above a descending trendline in USOIL signals a strong buy opportunity with a target set at the next resistance level.
3. RSI & MACD for Momentum Confirmation
- RSI (Relative Strength Index) above 50 confirms bullish strength, while below 50 indicates bearish momentum.
- MACD Crossovers: When the MACD line crosses above the signal line, it indicates a strong buy signal.
- Example: If RSI is above 60 and MACD confirms a bullish crossover, traders can enter a long position with confidence.
4. Volume Analysis for Trend Strength
- Increasing volume supports trend continuation, while declining volume signals weak momentum.
- Example: In the second image, the price breakout from $66.85 with high volume confirms a strong entry signal.
Optimizing Exit Points Using Trend Reversals
- Support and resistance levels: Take profits at key resistance zones in an uptrend.
- Divergence Signals: If price moves up but RSI moves down, a reversal may be coming, signaling an exit.
- ATR-Based Targets: Set take-profit levels based on market volatility to maximize gains.
Final Thoughts
Analyzing market trends helps traders make informed entry and exit decisions. By combining trendlines, moving averages, RSI, MACD, and volume analysis, traders can optimize their strategy for consistent profits.
For live market updates and expert insights, visit HiTradeOfficial and explore technical analysis tools on TradingView.
Best USOIL Trading Strategies for 2025 – A Step-by-Step Guide
USOIL (Crude Oil) remains one of the most actively traded commodities, offering excellent opportunities for traders in 2025. With market volatility and global economic factors influencing oil prices, having a well-structured trading strategy is essential for success. This guide outlines the best strategies to maximize profits while managing risks effectively.
1. Trend Following Strategy
How It Works: Traders follow the dominant market trend using technical indicators like moving averages and trendlines.
Key Indicators:
- 50-day EMA & 200-day SMA: A bullish trend is confirmed when the 50 EMA is above the 200 SMA.
- Trendlines: Drawn to identify support and resistance zones.
Entry & Exit Points:
- Buy Signal: Price pulls back to a support level within an uptrend.
- Sell Signal: Price breaks below a key support level in a downtrend.
Example: In the second image, a breakout above $66.85 with strong volume confirms a bullish trend, making it an ideal buy opportunity.
2. Breakout Strategy
How It Works: Traders capitalize on price movements when USOIL breaks key resistance or support levels.
Steps to Follow:
- Identify consolidation zones where price moves sideways.
- Enter the trade when price breaks above resistance (buy) or below support (sell).
- Confirm breakouts with high volume to avoid false signals.
Example: A breakout above $67.50 with increasing volume signals an entry point, targeting $69.00 as the next resistance.
3. Scalping Strategy for Quick Profits
How It Works: Traders enter and exit trades within minutes to capture small price movements.
Key Indicators:
- 5-minute and 15-minute charts for short-term opportunities.
- RSI & MACD: Identify overbought and oversold conditions.
Entry & Exit Points:
- Buy when RSI is below 30 and MACD shows a bullish crossover.
- Sell when RSI is above 70 and MACD indicates a bearish crossover.
Example: If USOIL price spikes to $67.80, and RSI shows overbought conditions, a short trade can be initiated with a quick exit at $67.50.
4. Swing Trading Strategy
How It Works: Traders hold positions for a few days to weeks, targeting larger price swings.
Steps to Follow:
- Identify major support & resistance levels on the daily chart.
- Use Fibonacci retracement levels to determine pullback areas.
- Confirm entries with volume spikes and MACD crossovers.
Example: A swing trader enters a long position at $66.50, setting a profit target at $69.00 and a stop loss at $65.80.
5. News-Based Trading Strategy
How It Works: USOIL prices react strongly to geopolitical events, OPEC meetings, and inventory reports.
Steps to Follow:
- Monitor news from Investing.com and ForexFactory.
- Enter trades based on fundamental events, such as OPEC production cuts or US crude oil inventory data.
- Use tight stop losses to manage risk.
Final Thoughts
In 2025, USOIL trading will require a mix of technical, fundamental, and news-based strategies for the best results. Whether you prefer trend following, breakouts, scalping, or swing trading, a well-defined approach will help you stay profitable.
For expert insights and live updates, visit HiTradeOfficial and check real-time crude oil price analysis on TradingView.
Conclusion: Mastering USOIL Trading Strategies for 2025
To succeed in USOIL trading in 2025, traders must combine technical analysis, trend identification, breakout strategies, and fundamental insights to make informed decisions. Whether you prefer scalping for quick profits, swing trading for larger moves, or news-based trading for volatility, having a structured approach is key.
Key Takeaways:
✅ Follow market trends using moving averages and trendlines for precise entries.
✅ Breakout trading works best when confirmed with high volume to avoid false signals.
✅ Scalping and swing trading require different risk management approaches.
✅ Use fundamental news (OPEC reports, US crude inventory data) to anticipate price moves.
✅ Always apply stop-loss orders to protect your capital and maximize profits.
By mastering these strategies and staying updated with market trends, traders can increase their chances of success in crude oil trading. For expert insights, visit HiTradeOfficial and check real-time crude oil market analysis on TradingView.
Top 10 FAQs About USOIL Trading Strategies for 2025
Discover the most frequently asked questions about trading USOIL (Crude Oil) in 2025, along with detailed answers to help you navigate the market effectively.
1. What Are the Most Effective USOIL Trading Strategies in 2025?
In 2025, traders are focusing on strategies such as trend following, breakout trading, and news-based trading. These approaches help capitalize on market movements and volatility.
2. How Does Geopolitical Tension Affect USOIL Prices?
Geopolitical events can lead to supply disruptions or increased uncertainty, causing significant price volatility in the oil markets.
3. What Role Do Moving Averages Play in USOIL Trading?
Moving averages, such as the 50-day EMA and 200-day SMA, help identify trends and potential reversal points, aiding traders in making informed decisions.
4. How Can I Manage Risk When Trading USOIL?
Implementing stop-loss orders, diversifying your portfolio, and staying informed about market news are key risk management techniques in USOIL trading.
5. What Are the Benefits of Using Technical Analysis in USOIL Trading?
Technical analysis provides insights into price patterns and market sentiment, helping traders identify entry and exit points.
6. How Do Supply and Demand Dynamics Influence USOIL Prices?
Fluctuations in supply and demand, driven by factors like economic growth and production levels, directly impact USOIL prices.
7. What Is the Impact of OPEC Decisions on USOIL Trading?
OPEC’s production targets and policies can significantly influence global oil supply, thereby affecting USOIL prices and trading strategies.
8. How Do Futures Contracts Work in USOIL Trading?
Futures contracts allow traders to buy or sell USOIL at a predetermined price on a specific date, enabling hedging and speculation.
9. Can Algorithmic Trading Enhance USOIL Trading Performance?
Algorithmic trading utilizes automated systems to execute trades based on predefined criteria, potentially improving efficiency and profitability.
10. What Are the Tax Implications of USOIL Trading in the US?
Profits from USOIL trading are generally subject to capital gains tax in the US. It’s advisable to consult a tax professional for specific guidance.
For more insights and updates on USOIL trading strategies, visit HiTradeOfficial.


