About This Image :-
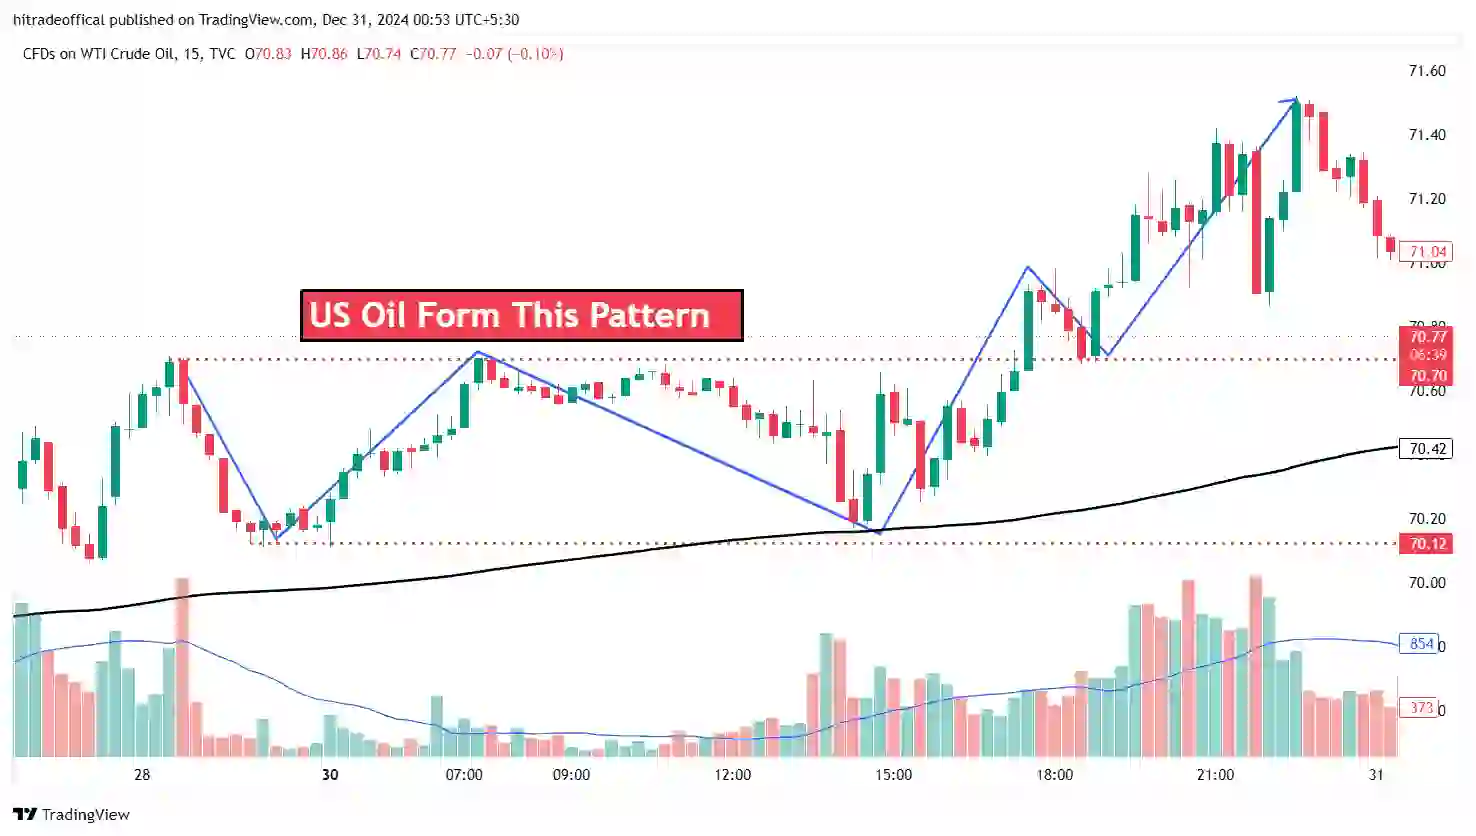
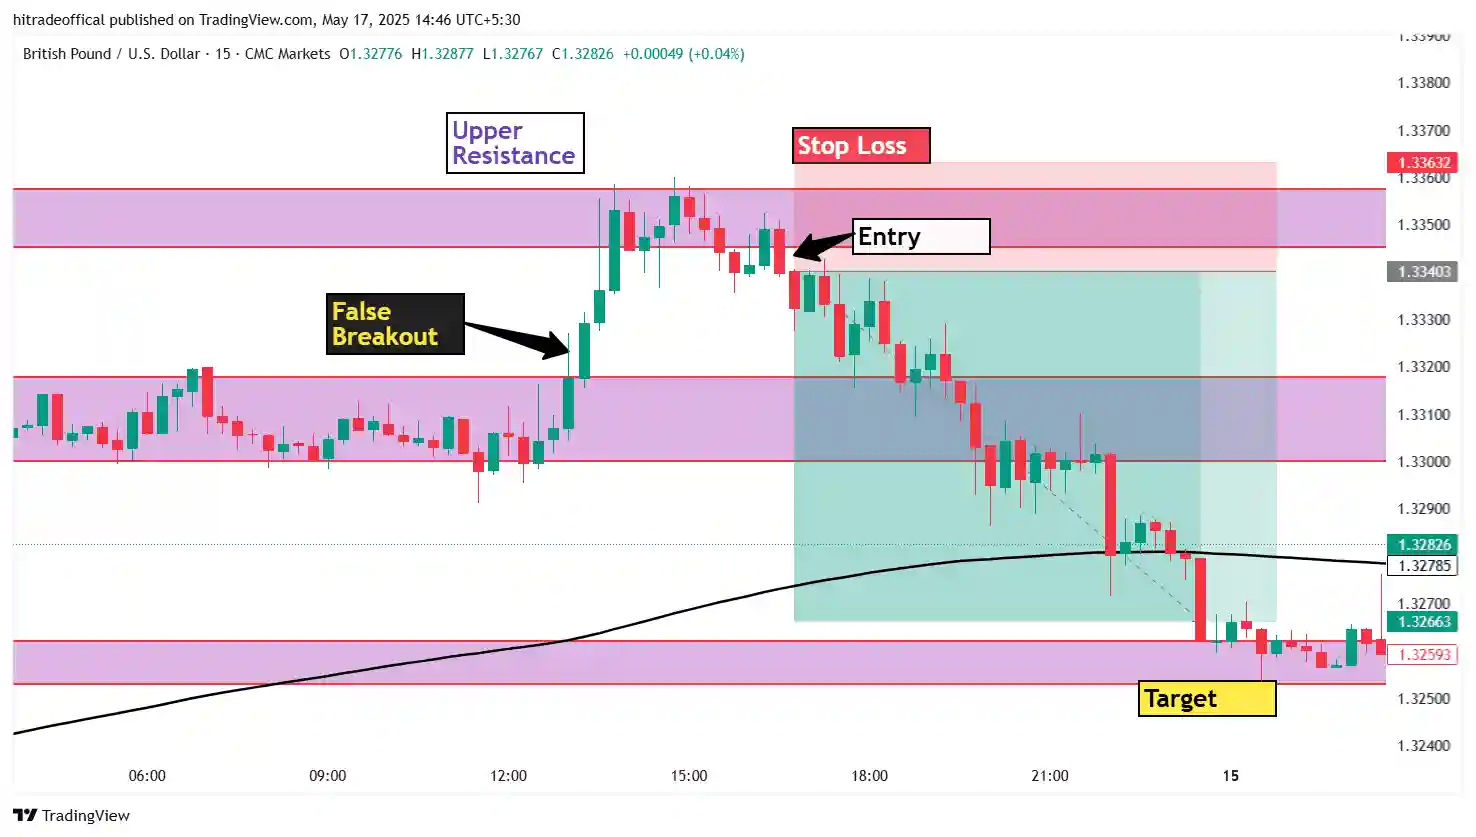
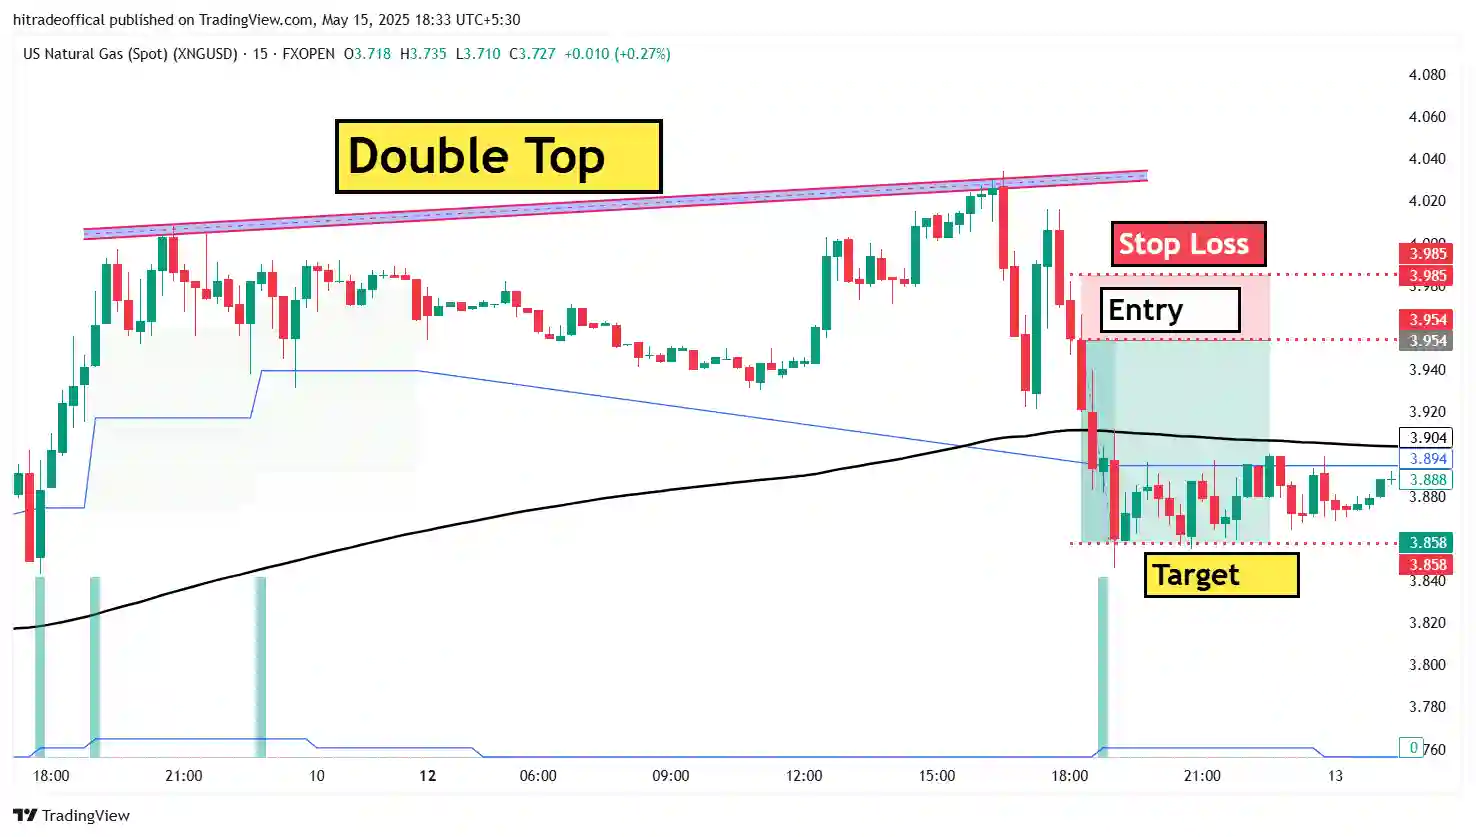
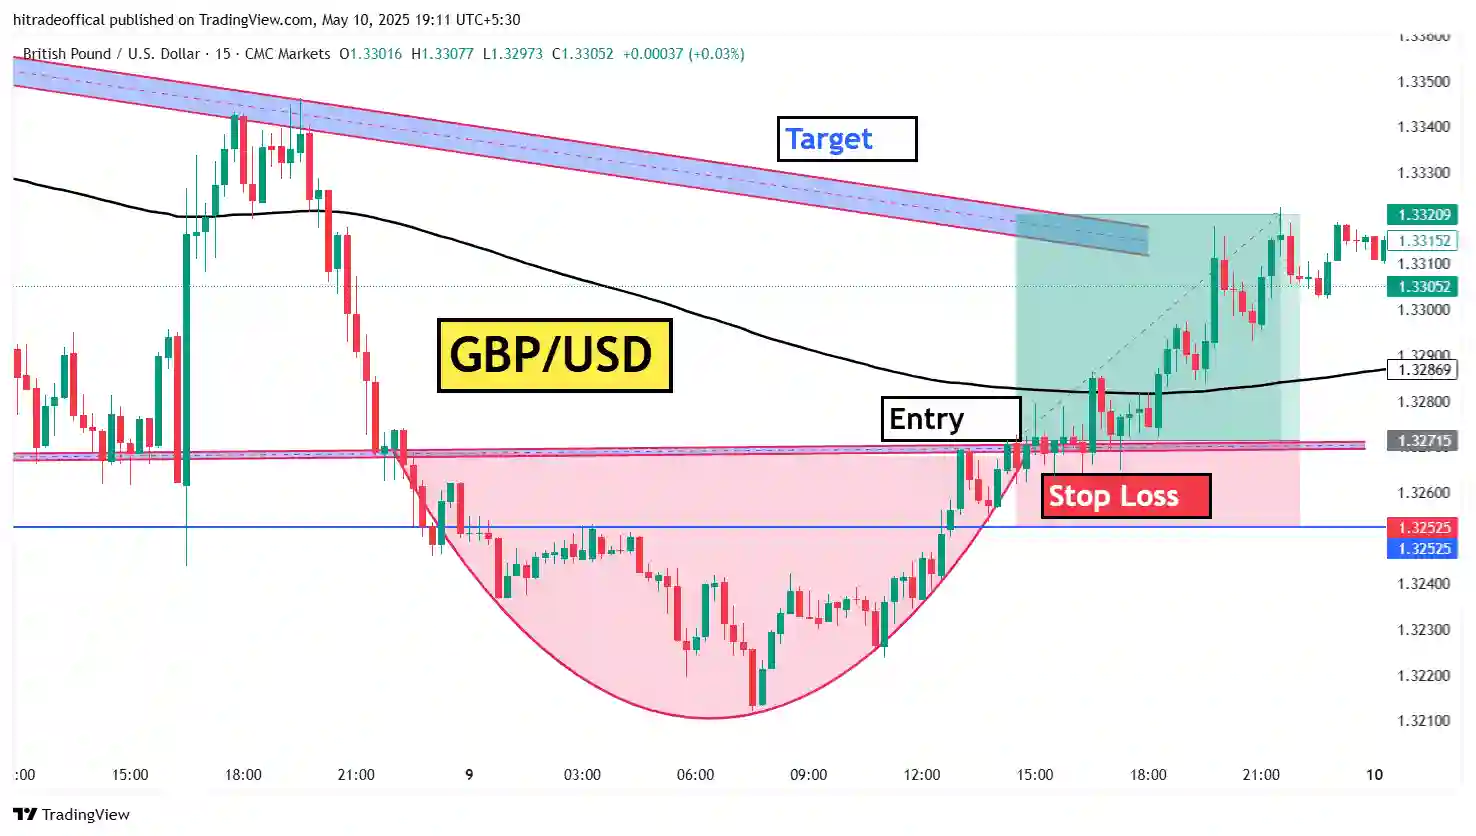
- In this image you can see that US Oil chart form horizontal like pattern so in this post we talk about this pattern and also talk about what is the basic pattern for US Oil Trading.
- Welcome to this post now keep learning and careful learning.
How to find best pattern for US Oil Trading :-
If you want to find best pattern for US Oil trading than first to first you have to focus on the chart if you see daily chart and also for intraday level if you see always chart.
Than you can first to first identify structure of the chart than than you also feel best pattern for US Oil trading in intraday level like that,
In this post or in this image you can see that we draw two line you can say that this like name is horizontal like and according to this line we find best pattern for trading.
If you also follow our this point than you can also find best pattern for trading and our best point is see always market with patience and focus on chart nothing need more.
What is the basic pattern for US Oil Trading :-
In US Oil Trading we feel according to chart and also according to previous date there are some pattern which is basic pattern and also follow always in US Oil Chart.
Let you can check and also you can test using back test before trade the basic pattern is here like double top, double bottom, horizontal line trading, zone or box pattern.
These are some basic pattern for US Oil trading if you want to check than you can do back test for this pattern and than if follow this pattern than you can say in comment “yes”.
Finally, if you focus on these basic patterns than you can easily trade and earn money using US Oil trading but first to first you need more and best practice on this pattern.
What is the Pattern :-
In trading and also in any field the pattern simply meaning by some a structure and process and data which follow multiple time that is known as patterrn.
But in different books and person may be different definition but overall meaning is same and in trading definition is no need.
Here need you practical knowledge and practice if you have good practice on chart and you have good strategy than you can easily get success in trading.
So, overall you need to focus on chart and pattern pattern and some strategy for remove your emotional decision in trading try to take decision according to logic not emotion.
What is Resistance in Trading :-
The upper point or range where price reached maximum time that point is know as resistance and if you want to know more knowledge than you can see our post image.
When you are finding and drawing resistance than also remember the main point which is zone that means during resistance analysis don’t draw line you try to draw a zone.
If you draw a zone than that is very helpful for your trading when you live in the market that time you feel zone is better than line.
If you want to test your resistance zone or line than you can also test with the help of price if price is respect your resistance line or zone than this zone is good for trading.
What is Support in Trading :-
The lower point or range where price reached maximum time that point is known as support and if you want to see live support than you can see our post image there you can see,
The two red color horizontal line and the lower line which is known as support in trading. you can see live in our post image.
When you are finding and drawing support than also remember the main point which is zone that means during support analysis don’t draw line you can try to draw a zone.
If you draw a zone than that is very helpful for your trading when you live in the market that time you feel zone is better than line.
If you want to test you support zone or line than you can also test with the help of price if the price is respect your support line or zone than this zone or line is good for your trade.
How to see Volume in Trading :-
Volume is a type of indicator. And indicator main work is indicator not take trade according to indicator but you can feel what is saying market.
So if you want to see volume than also remember don’t try to trade only on the basis of volume or any indicator but if you are a beginner in trading than you need some indicator.
But after some time when you have lots of experience that time you also feel indicator is not more useful for every situation but starting time you need some indicator.
There are some point with the help of you can see volume in trading :-
- The first point is add volume indicator on the chart.
- The second point is always remember volume work is show how many buyer or seller present in market.
- In Volume two types of color
- If the volume color is green than you can say that buyer is more in the market.
- If the volume color is red than you can say that seller is more in the market.
This is the some basic point point and remember or focus my word I said only basic point not advance in advance level lots of knowledge.
The main point is if you have no more knowledge about any indicator than don’t use first you learn about that then use if you use without knowledge any indicator than you need to face losses you have no more options.
What is the plan for Forex Trading :-
Our main plan for every trading is chart pattern, chart analysis, price action or candlesticks if you have good knowledge than you no need other things.
Here in trading you have to also follow our this line In trading you have to take decision using logic not emotion if you include than may be you not get success in the trading.
So you also try to focus on strategy, emotion, discipline and patience and if you don’t focus on these points than also you have to faces more losses.
Here some point with the help of this you can improve these the the point is reading book, meditation, exercise and positive thing with the help of this you can improve.
Overall plan is for forex trading is focus on chart pattern and before any entry try to find trap because without trap not give right trade in trading.
In forex trading also some basic pattern is follow you can say that if you focus some basic pattern than you can easily get success in the forex trading.
This is the chart of US Oil but different time frame :-
About this image :-
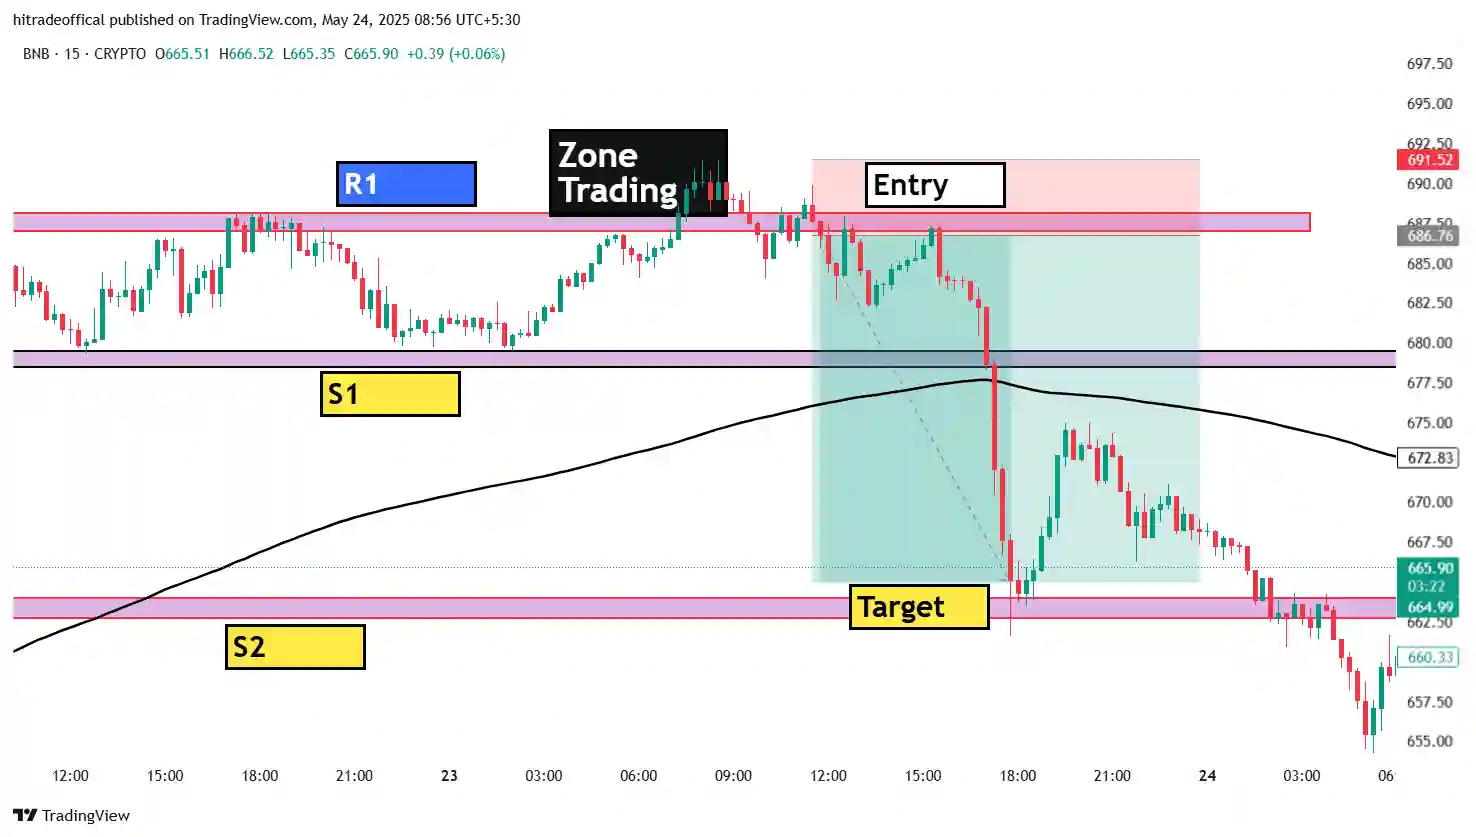
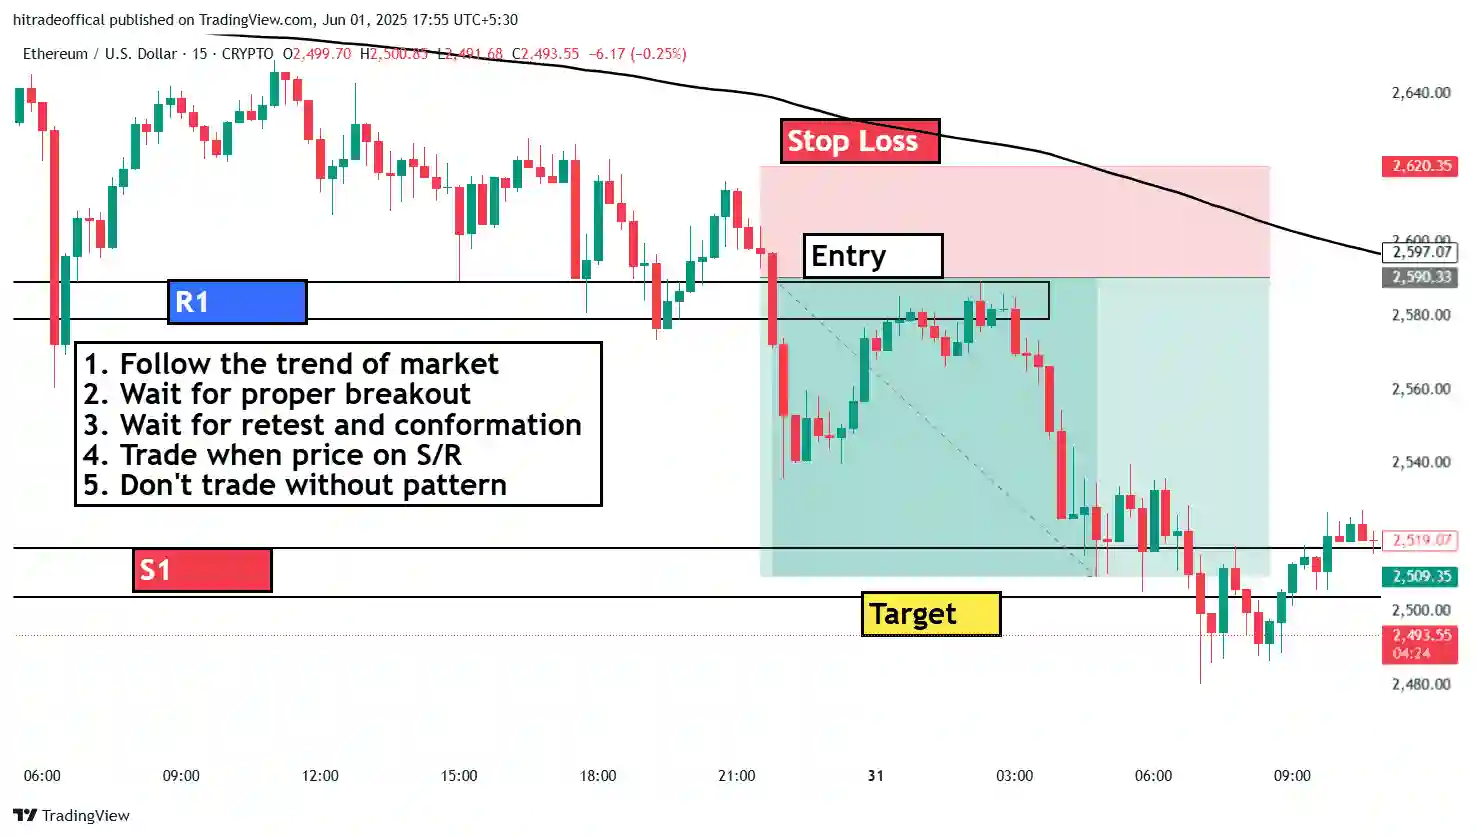
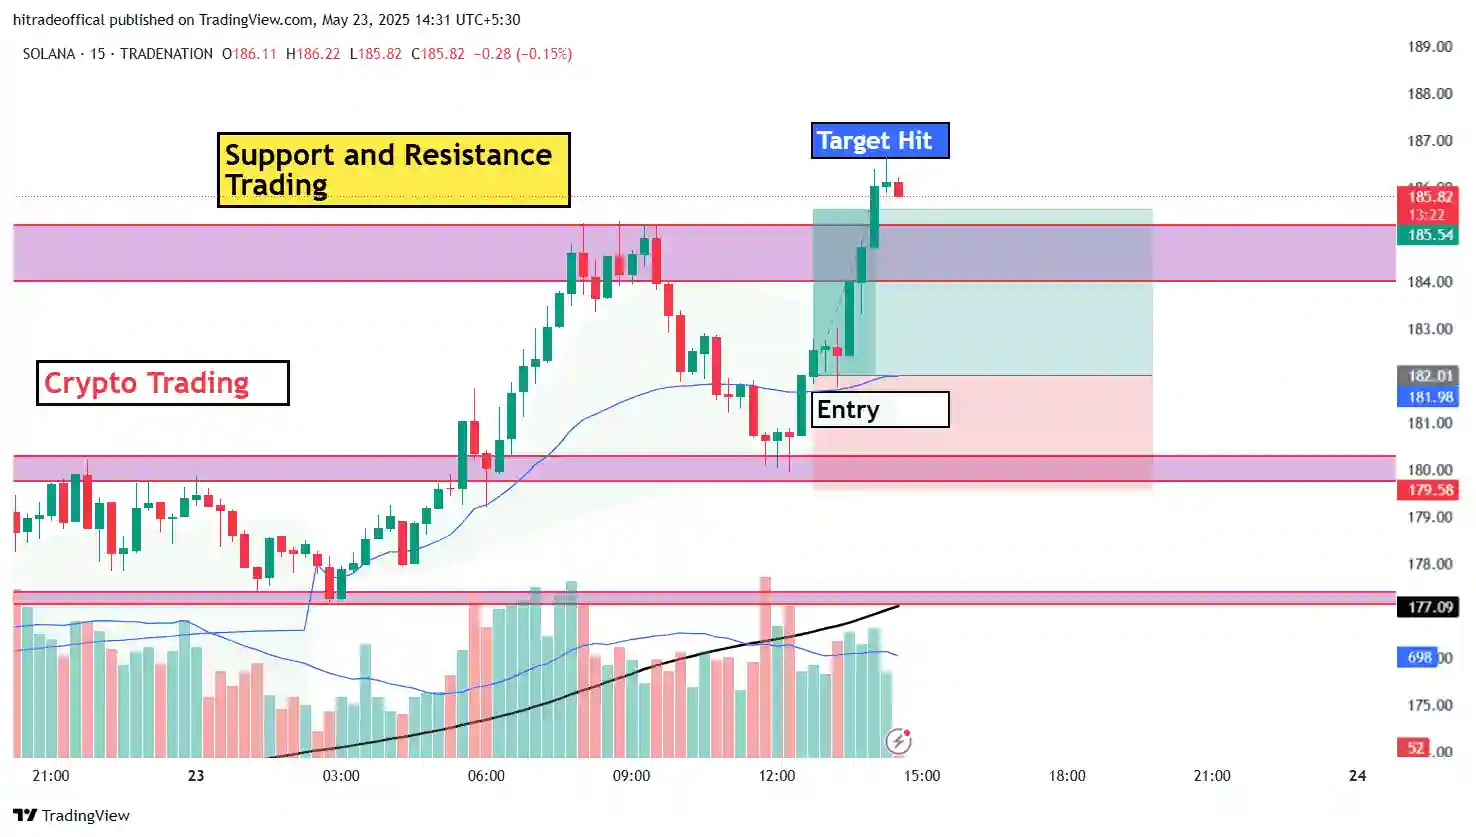
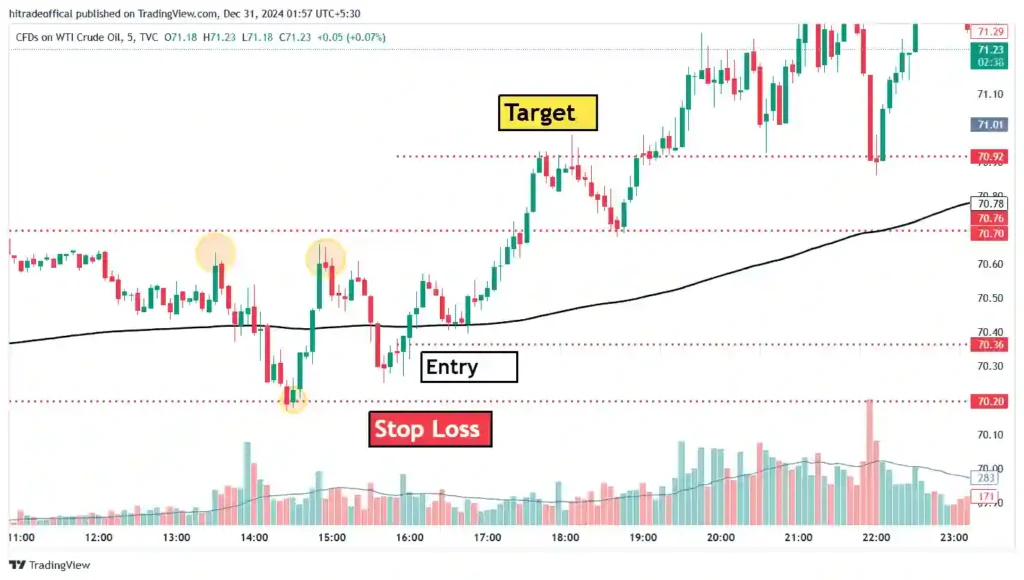
In this image you can see that we draw some point like entry point, stop loss point and target point also we draw some horizontal line.
Here, we learn all the point like how to find entry point or what is our entry point, what is our stop loss point and also how to find target point.
What is our Entry Point :-
In US Oil trading for entry time is most important and also in every forex trading time is very very important like you can see on chart some particular time volume is big and also movement is good.
When movement is good that is our best entry time so first to first focus on time after than focus on chart pattern or price action.
In this image you can see that two time we can get good entry point like when price is on the support that is also good time for entry.
If you miss that entry point than also after some time if you see chart than price break the resistance and start retesting that is our also best time for entry.
So, overall if you see and fell the chart than you can say that chart give more opportunity but we have no patience so we loss our capital and saying trading gambling.
What is our Stop Loss Point :-
In this post also we are not saying number form what is our stop loss point but according to chart we are saying what is our stop loss point.
In swim trading as well as long time trading maximum trader try to avoid this point but you don’t try to avoid this point.
Because what is the of this point you can protect your capital and you can easily safe your money if you don’t want to waste your money than don’t try to avoid this point.
So, now if you need stop loss than you can take logical point as well as you can set in your mind if price reached that point than I will exist.
May be this point is logical but this process is protecting your capital as well as your money so don’t try to avoid this.
What is our Target Point :-
There are lots of method to find your target point some methods are following :-
- The first method is you can take target according to logical point. like that logical point is anything.
- The second method is you can book target using technical methods.
- The third method is according to nearest support or resistance.
- The fourth method is you can book your target using percentage like that you can set in your mind when this trade hit 10% out of our capital than I will book profit.
This way you can easily find your target point. Here, we said four methods you can use any one method and you can easily book your target.
What is the learning of this post :-
There are lots of learning point in this post like that :-
- The first learning of this post is How to find best pattern for US Oil Trading.
- The second learning of this post is What is the basic pattern for US Oil Trading.
- The third learning of this post is What is the pattern.
- The fourth learning of this post is What is resistance in trading.
- The fifth learning of this post is What is support in trading.
These are first five for learning of this post. If you want to learn than you can use these titles for learning and according to these you can learn easily.
Thank You For This Post And For More Update You Can Follow On YouTube
