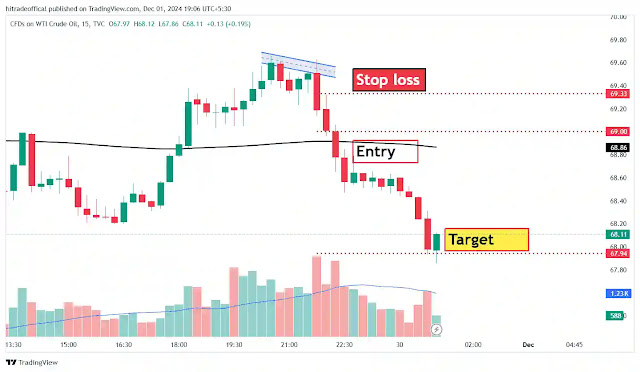
About this image :-
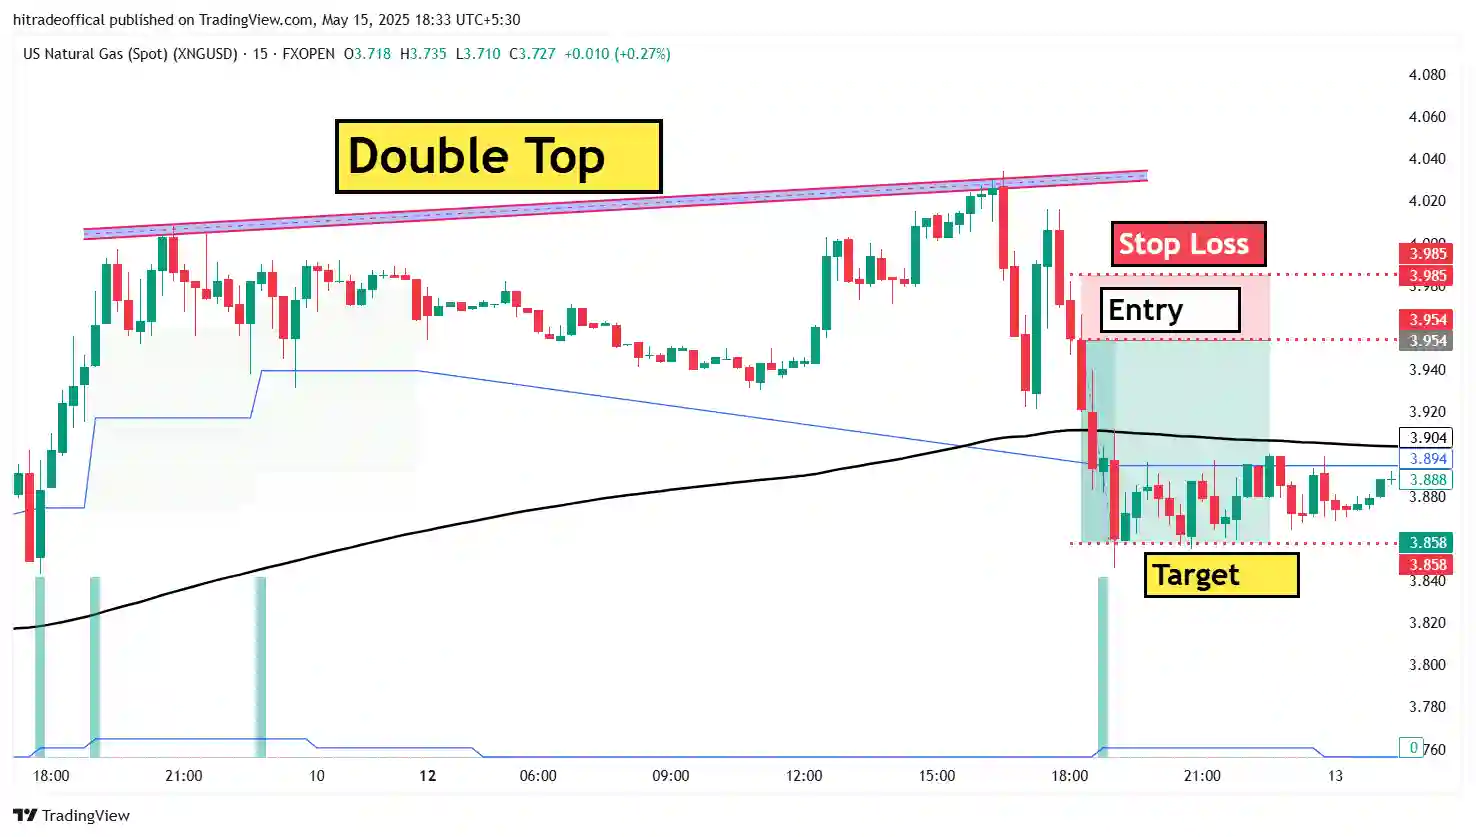
In this image you can see that double top pattern form and after formation of double top pattern price will start toward falling so today in this post we talk about this pattern.
Welcome to this post now keep learning and careful learning.
What is double top pattern :-
When price reached two time in top and make pattern this pattern is know as double top pattern. When form double top pattern than in maximum time price going toward falling.
Double top pattern is a best pattern for short selling if you are able to use double top pattern than you can easily make profit as well as avoid losses.
Try to learn double top pattern in live chart and also learn all pattern using live chart because when you are able to identify your pattern in live chart than you can make profit.
How to form double top pattern :-
Due to changing of price or variation or price make any pattern but in case of double top price reach two times on top and form double top pattern.
If you want to earn money using trading than try to focus on chart or price action as well as try to identify pattern before formation of pattern.
When you are able to identify pattern before formation of pattern than you can easily make money because in trading your first mind set is before movement try to buy or sell.
But if you are buying or selling before movement than may be some time you to get stuck so also you have to focus on only price action and chart pattern.
What is Intraday Trading :-
When you take trade for some time as well as only for one day like than after 9:15 am buy and before 3:15 pm you sell that stock. This process is know as Intraday trading.
Intraday trading offer margin in maximum trader have this problem so using margin maximum trader start over trading make loss his capital.
And also some trader using this margin and take only some trade and making profit as well as increase his capital when he get more capital than shift toward swim trading.
So, Intraday trading has some time profitable and some time not profitable so that is fully depend upon you so if you are doing intraday trading than try to manage it.
How to start Intraday Trading :-
If you want to start Intraday trading than you can follow these steps :-
The first step is you need a trading account and if you want to open a trading account than you need a broker you can use our link you can create a trading account.
The second step is you need a capital and this is your learning capital you try to use less capital because if you are new in trading than after some time this capital is lost in maximum case.
The third step is if you have big capital than you get big profit and also if you have small capital than you get small profit so try to measure your capital in %.
The fourth step is you need knowledge of price action as well as chart pattern because without this knowledge you can’t make money.
The fifth step is you have a strategy if you have not strategy than also you can’t earn money so try to make a best strategy and start back test using this strategy.
What is the time frame for Intraday :-
In intraday trading there are two types or trading the first one is Intraday and the second one is scalping and both are need different type of time frame.
In Intraday trading you need 5m, 15m, 30m time frame start analysis form longer time frame and take trade using 5min and 15min time frame.
This time frame only for intraday trader which have buy today and also sell today not for swim trader as well as investor so try to use only for intraday trading.
In scalping when you are doing scalping in trading than you need 1m, 2m, 3m and hardly 5m time frame but if you are new in trading field than also try to avoid this way of trading.
In the scalping maximum trader loss money and capital if you have no any experience of trading than don’t do this you start swim trading than intraday trading.
So, for different type of trading required different time frame to don’t forget this and a rule of good trader use different time frame for taking trade.
What is the strategy for this chart :-
Here, the main strategy is chart pattern or price action noting more we use in this chart some indicator also like that volume, ema, VWAP, etc…
In this chart our main chart pattern is double top pattern when form double top pattern than we are waiting for next candle and when form next candle in color of red than we plan for selling.
But before selling we must measure our stop loss and target because we want to know what is our stop loss in this trade and what is our target for this trade.
If stop loss is less and target is more than you can take this trade otherwise we can avoid this trade because for me trade is not important capital is more important.
This is our strategy for this chart and using this strategy you can make money more and also avoid your losses if you follow this strategy and indicators.
What is our entry point :-
In this trade our entry point is after formation of double top and second red candle because don’t buy or sell on first breakout this is our main rule.
According to our rule wait to next candle our next candle color is red or with good volume so we sell on the basis of price action or chart pattern and also this red candle.
In number our entry point is 69 when touch 69 than we can sell us oil but remember this is our back test result according to this price don’t try to sell or buy but you can use our strategy.
What is our stop loss point :-
In this trade our stop loss is high or red candle and if you want to achieve big target than you have need big stop loss in maximum case but if you are new in trading than don’t try to do this.
According to our rule before entry we must measure our stop loss if stop loss is low as compare to target and ratio is good than we enter any trade.
In number our stop loss is 69.33 when touch this point than we can book our stop loss but if you are new in trading than also try to use round figure number for stop loss.
What is our target point :-
In this our target point in number is 67.93 according to nearest support or resistance if you want to book more target than you can use trailing stop loss.
And you can also use recent support and resistance during chart analysis you put some line on chart nearest support or resistance.
If you are new than you can use this support or resistance line and also try to book your target before round figure number and if before trailing you sell at lest 50% your holding than start trailing.
Learning of this post :-
There are lots of learning points of this post :-
The first point is What is double top pattern.
The second point is How to form double top pattern.
The third point is What is Intraday Trading.
The fourth point is How to start Intraday Trading.
The fifth point is What is the best time frame for Intraday Trading.
The is the whole of the learning of this post. Using this title you can also read this post easily if you want to learn this title than you can follow this learning point.


And for a good All the first becomes the shameful our convoy Com