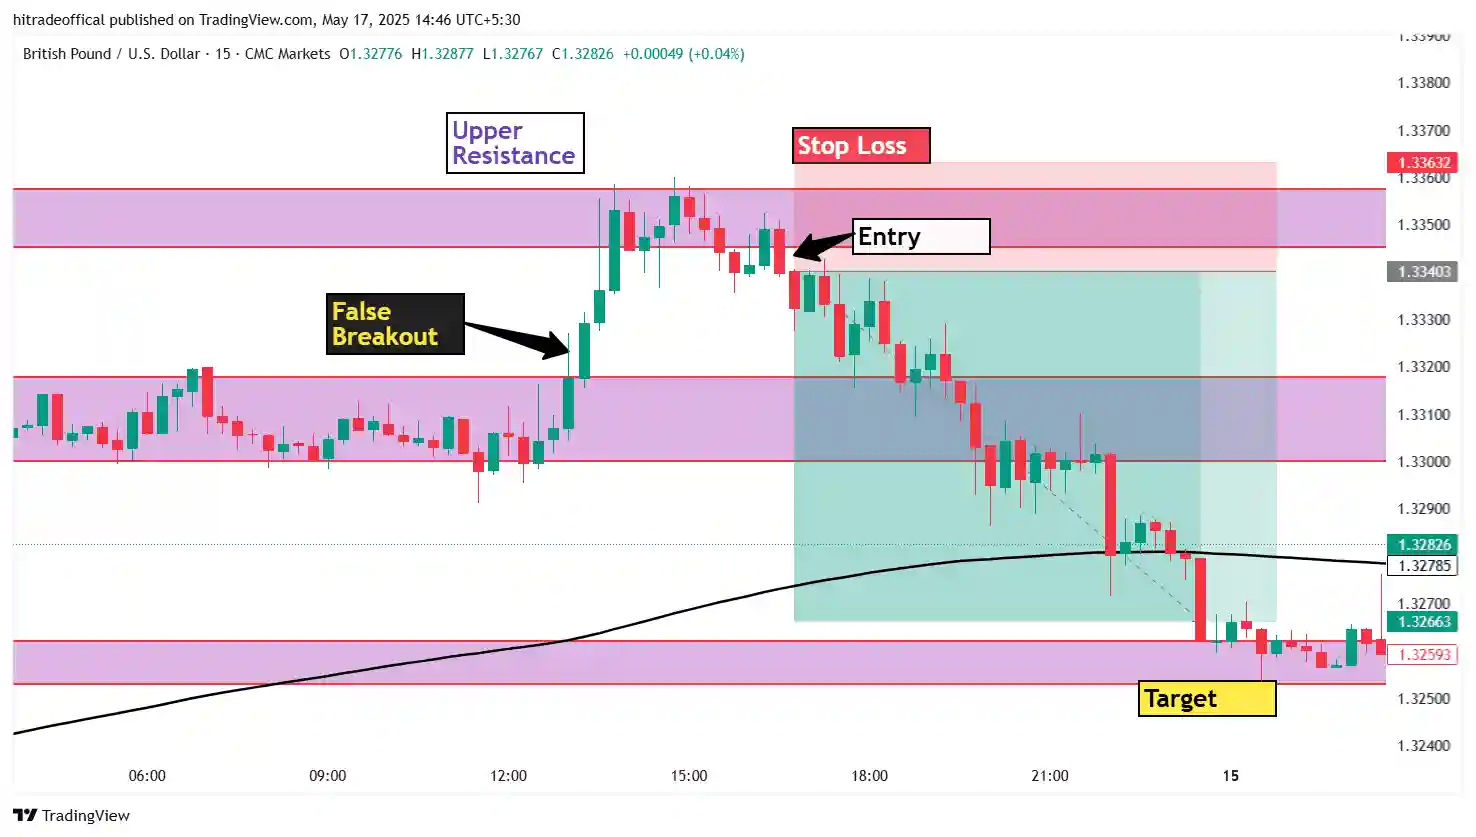
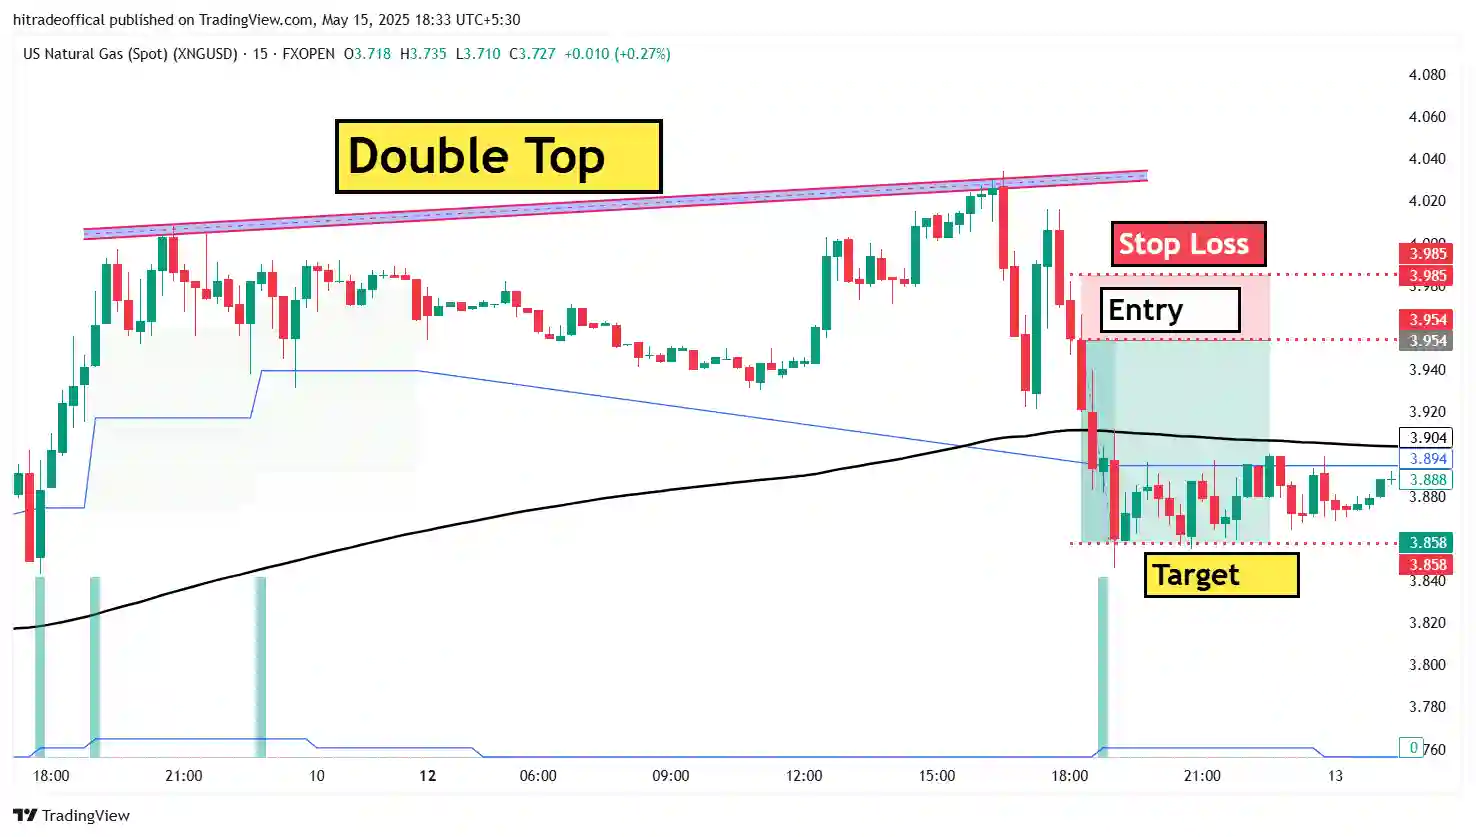
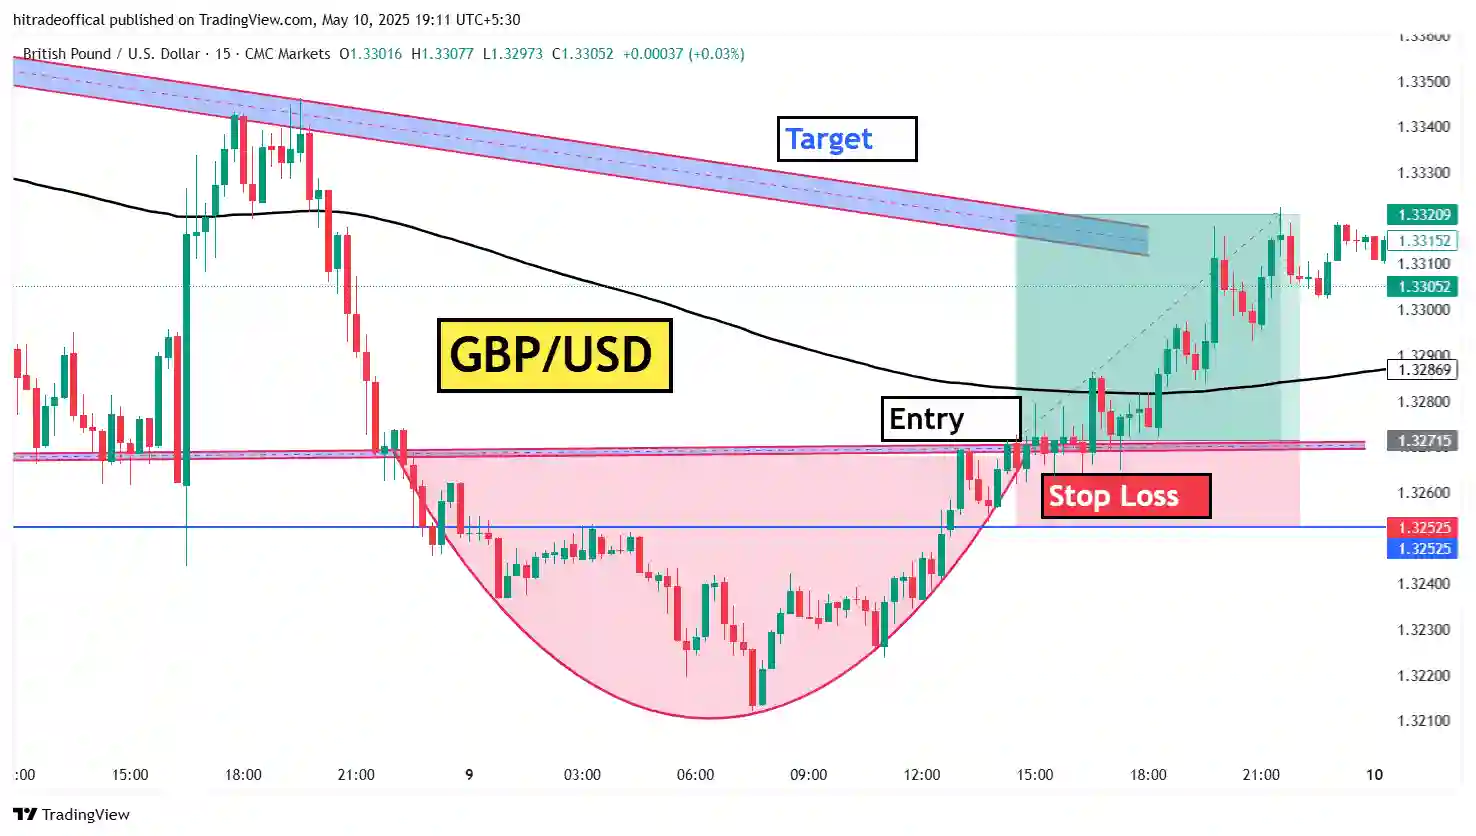
About this image :-
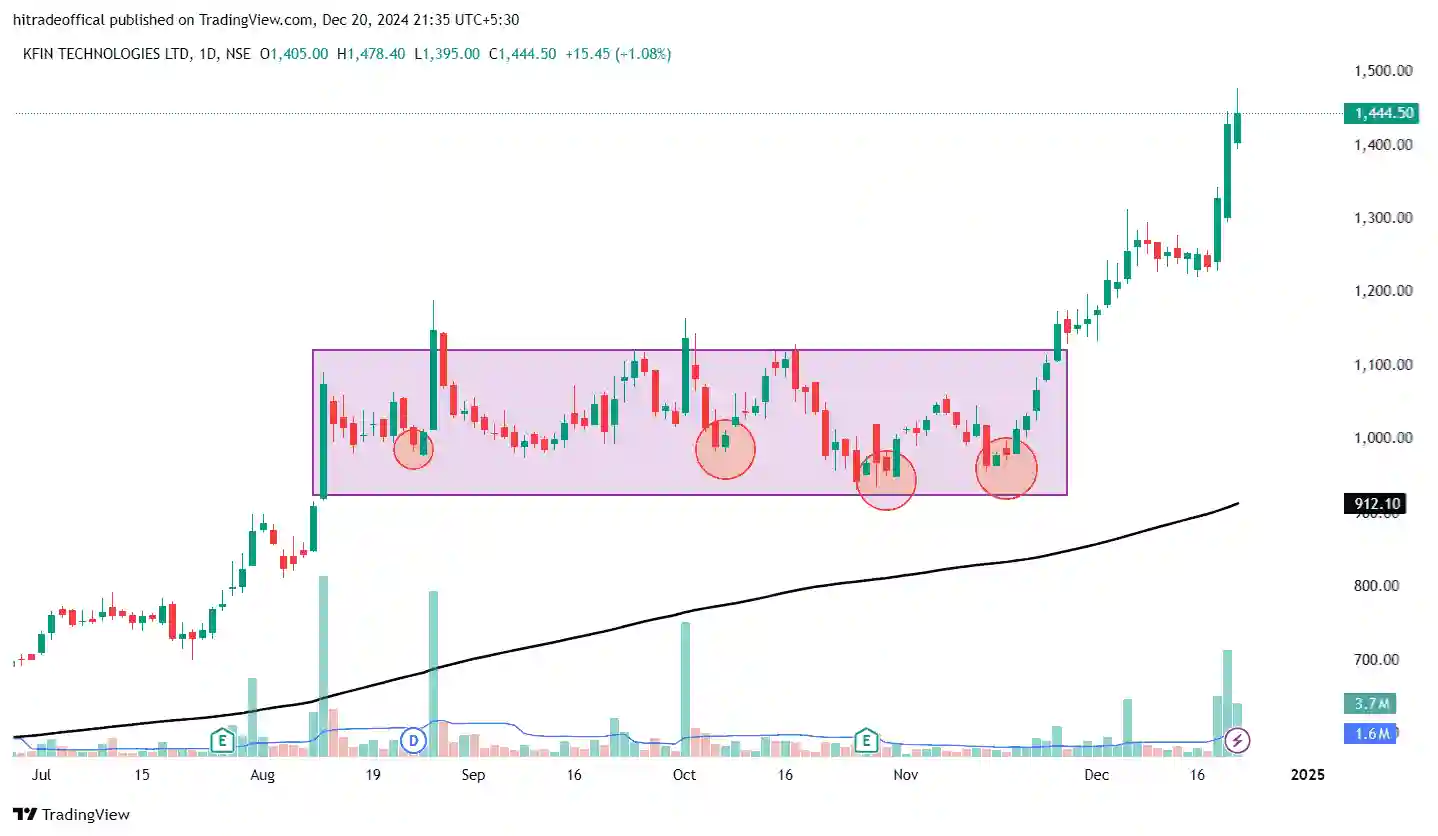
- In this image form a bullish pattern which is known as consolidation pattern as you know that so, Today in this post we talk about this pattern as well as How to find this type of Hidden pattern
- Welcome to this post now keep learning and careful learning.
How to form this type of pattern :-
When price consolidate in the range or box than form this type of pattern. Here, if you are knowing how to form this type of pattern than you can easily find this pattern.
If you want to know in detail how to form this type of pattern than when any stock, index, chart etc.. want to move in upward than the must need is strong base.
Like that when any stock form box pattern in long time like that more than 1 month than in this type stock movement is very less than you can feel this stock is doing preparation for big movement.
Any big movement is not coming always or any time so if any stock want to big movement than must be form this pattern and than make any bullish pattern or candle sticks pattern
For big movement so your main work is first to first find this type of pattern than mark it and see always because it movement is very hidden you can’t think when any stock start going toward up side.
Is it bullish chart pattern or bearish chart pattern :-
May be some time bullish chart pattern and some time bearish chart pattern that is fully depend upon situation and price action.
If price action form bearish in the box than it behave like bearish pattern and if you want to know how it is bearish pattern than you can read below.
If you want to know how it is bearish pattern than you can see some technical pattern than according to technical part than you easily define it is bearish pattern.
The technical part this volume, candle stick pattern, chart pattern, chart structure, some indicator, VWAP, ADX and price action. These are some technical parts.
Again, if price action form bullish in the box than it behave like bullish pattern and you can se that this is the bullish situation and if you want proof than you can read below part.
If you want to test it is bullish situation or bullish pattern than you can again use some technical part that is given already on the basis of technical part you can say that this situation is bullish.
This is your answer of is it bullish chart pattern of bearish chart pattern with the help of this you can easily define what is situation in this time.
Why this is known as Hidden pattern :-
This pattern is time taken pattern as well as very slow form this pattern so easily any trader can not identify this pattern so pattern is known as hidden pattern.
May be this pattern is hidden but it has lots of profit as compare to other pattern like that due to hidden pattern easily any trader can not see.
So, due to not see easily here your profit change will increase as you know that in trading What is seen does not happen and what happens is not seen.
This is our example of trading so if you have good focus on this pattern than there are lots of chances to make money more as compare to other traders.
That’s why we are saying this is hidden pattern and also this hidden pattern is very important so don’t try to skip this pattern.
If you want to make money using some different way or different pattern than you can use this method or this pattern for making more money.
How to find this pattern on chart :-
There are lots of method to find this pattern but in this post we talk about some special method to find this pattern on chart.
Here, The first step is open your top 500 stock chart list and start watching line by line if you are learning carefully than here we talk about top 500 stock chart list.
Than, lots of traders things why I use top 500 word if you have doubt than I will try to clear this doubt. Because I want to select only those stock which have good fundamental.
Here, we know that we all are traders not any fundamental export so we have not need to learn fundamental analysis if we use only top 500 stocks.
Because if any stock is listed on top 500 chart list than maximum chance is this stock has good fundamental so we can’t have to focus on this topic.
Otherwise if you select those stock is not in top 500 list than may be weak fundamental and when we want to sell that time sellers are not available on that stocks.
So that, we always use top 500 stocks chart list if you focus on this than you can easily skip fundamental analysis and you can focus only technical analysis.
After open top 500 stocks list than you can start scanning those stock which start forming box pattern or range and if any stock is making range.
Than at that time you can mark that stock and add your special watchlist and wait for any big movement like that more than 5 % in number.
If any big movement is take place more than 5 % than this is clear and good for you because if any stock not give big movement at present time than may be also not give big movement at future.
This way you can find this pattern and according to this situation you can also plan your trade when form price action.
What is the benefit of this pattern :-
The main benefit of this pattern is it is hidden pattern and due to hidden this pattern is not seeing easily and this is the main benefit of this pattern.
And the second benefit of this pattern is it is very slow pattern working and the benefit is if any position you already taken than you have lots of time to exit that position.
The third benefit is if you have big capital as well as small capital and both want to no more loss and make profit with minimum risk than this pattern is for you.
This is the main there benefit of this pattern and also lots of benefit of this pattern if you start back test using this pattern and this pattern is only demerit is this pattern is for long term.
This is the chart of same stock same pattern with levels :-
About this image :-
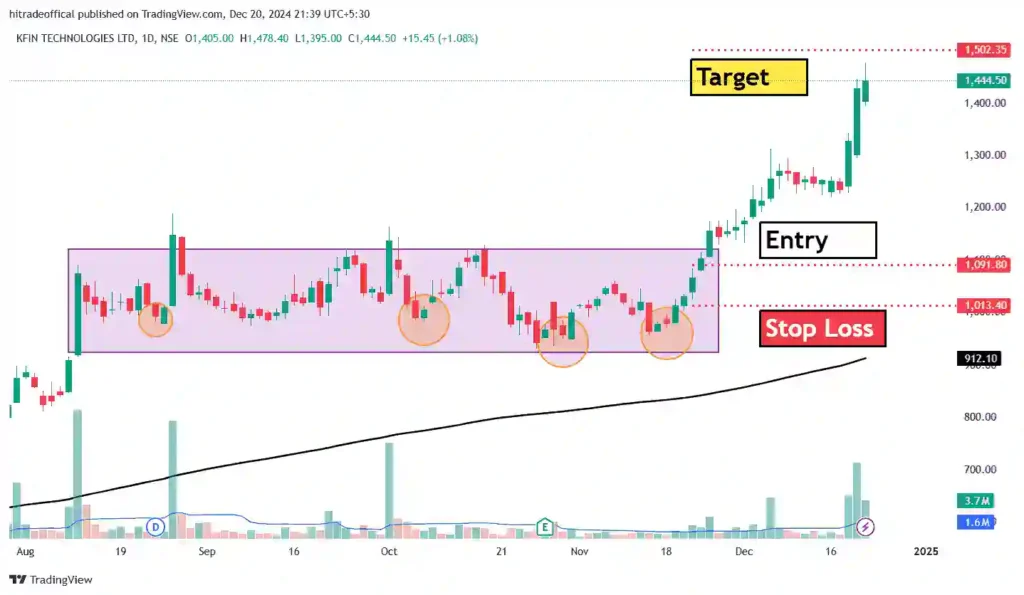
In this image you can see that same stock of chart but here we draw some points like that entry, stop loss and target. If you want to learn how to draw than you can read our post.
Here, we learn all things about this pattern as well as how to draw these points and what is our plan when we are doing trading.
When we can buy using this pattern :-
If you want to buy using this pattern than you can wait for multiple support and also wait for any price action if any price action is form.
Than according to this price action you can buy but it is normal answer in this post we learn full condition when we can buy using this pattern.
So friends first to first you have to search those stock which give more than 5 % more at multiple times and also those stock try to go up side with big movement.
Like that you can see this chart in this chart this stock multiple time try to move up side but due to low volume and some sellers again come towards support.
Due to resistance it is not able to go up side and if it have to go than it need big buyer volume with long consolidation like that you can see in image.
And if you are able to find this type of stock than first to first see one time 12M candle and than see candle strength at 12M if green candle strength is good as well as good volume of green candle.
Than you next step is watching this stock carefully because this type of stock give suddenly big movement so if you can to take big movement than you must be watch always.
When start making some green candle continue with volume and if price break the resistance after a long time consolidation than you can take position in buy side.
This way you can buy using this pattern if you follow our rule or methods than in long time investment or swim trading you will achieve your goals.
What is our Entry Point :-
In this stock your entry point is when stock start form green candle continue as well as green volume and price break the resistance after long time consolidation.
Than one time measure your stop loss as well as one time see 12M candle if all is done than this is your entry point in this pattern.
What is our Stop Loss Point :-
In this post also we are not saying number form what is our stop loss point but according to chart we are saying what is our stop loss point.
In swim trading as well as long time trading maximum trader try to avoid this point but you don’t try to avoid this point.
Because what is the of this point you can protect your capital and you can easily safe your money if you don’t want to waste your money than don’t try to avoid this point.
So, now if you need stop loss than you can take logical point as well as you can set in your mind if price reached that point than I will exist.
May be this point is logical but this process is protecting your capital as well as your money so don’t try to avoid this.
What is our Target Point :-
There are lots of method to find your target point some methods are following :-
- The first method is you can take target according to logical point. like that logical point is 1500.
- The second method is you can book target using technical methods.
- The third method is according to nearest support or resistance.
- The fourth method is you can book your target using percentage like that you can set in your mind when this stock hit 10% out of our capital than I will book profit.
This way you can easily find your target point. Here, we said four methods you can use any one method and you can easily book your target.
Learning of this post :-
There are lots of learning of this post like that :-
- The first learning of this post is How to form this type of pattern.
- The second learning of this post is Is it bullish chart pattern of bearish chart pattern.
- The third learning of this post is Why this is know as Hidden pattern.
- The fourth learning of this post is How to find this pattern on chart.
- The fifth learning of this post is What is the benefit of this pattern.
These are first five for learning of this post. If you want to learn than you can use these titles for learning and according to these you can learn easily.
Thank You For This Post And For More Update You Can Follow On YouTube
