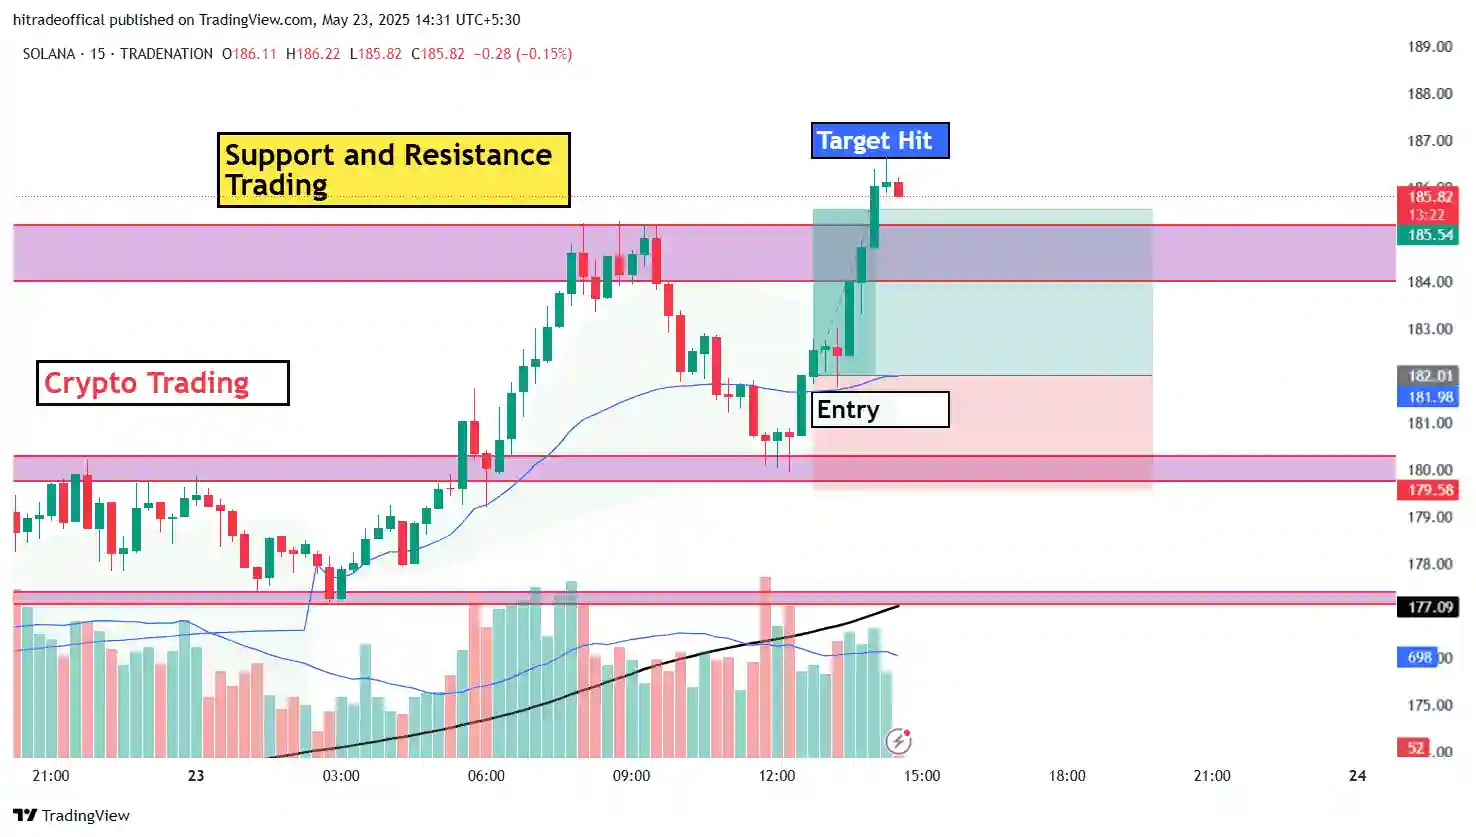
About this image :-
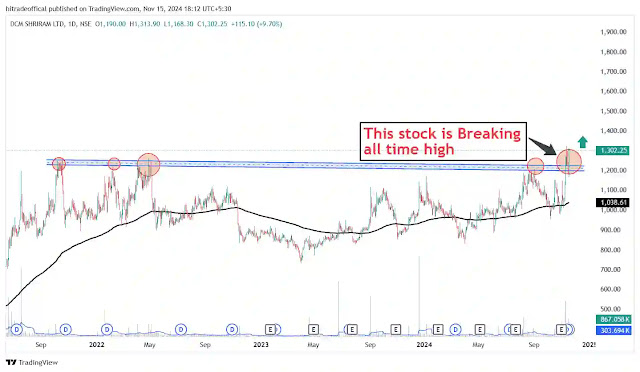
In this image you can see that we draw a horizontal line and this stock touch multiple times of horizontal line and today this stock is breaking horizontal line.
If you want to learn strategy and making profit and also you want to know how to trade this stock for making profit so today in this post we talk about this whole things.
Welcome to this post now keep learning and careful learning.
What is trending stock :-
If any stock give more than 10% return in one day and if stock is giving more return as compare to before return than this type of stock is called trending stock.
If you want to find trending stock than you can learn our next title and also if you want to trade in stocks than try to trade on that stock which is trending in this time for making good profit.
How to find trending stock :-
There are some steps if you follow these steps than you can easily find trending stock :-
The first step is open your top 500 stock list and start scanning and find any pattern.
The second step is when any stock form any pattern than mark it and see always.
The third step is wait for any big movement and this big movement is good for you.
If you follow these steps than you can easily find best trending stock and if you select any stock than big movement is most important.
Because this big movement is prove that your stock is trending and you can wait for any price action and also according to price action you can trade in trending stocks.
What is trendline breakout :-
When any stock is breakout any trendline and pattern than this is called trendline breakout.
If you are doing trading than trendline breakout is very important concept. And with the help of trendline breakout you can take trade and only on the basis of trendline breakout try to avoid trade.
What is the right method of finding stock :-
There are lots of method of finding stock but we can focus on different and original method.
The first step is open your top 500 stock list from your index.
The second step is start finding pattern and scanning chart.
The third step is when any stock form any pattern than mark that chart and see always.
The fourth step is wait for any big movement.
The fifth step is if any big movement is take place than this is right stock for trading.
This is the right method of finding stock. But if you know other or different method than you can also follow your method but before take any trade one time test your strategy.
Which stock is good for trading :-
Here, every stock is good for trading but that is fully depend upon you what you want to do in market like that if you want to start selling in live market than you need to find those stock which is start falling now.
Similar, if you want to start investment in market than you can find those stock which long time return is good and form any pattern or breaking any zone or pattern.
So in trading the most important thing is time like that some time some stock is giving good performance but after some time same stock giving bad performance so that is fully depend upon time as well as price action.
This is the chart of same stock but different time frame :-
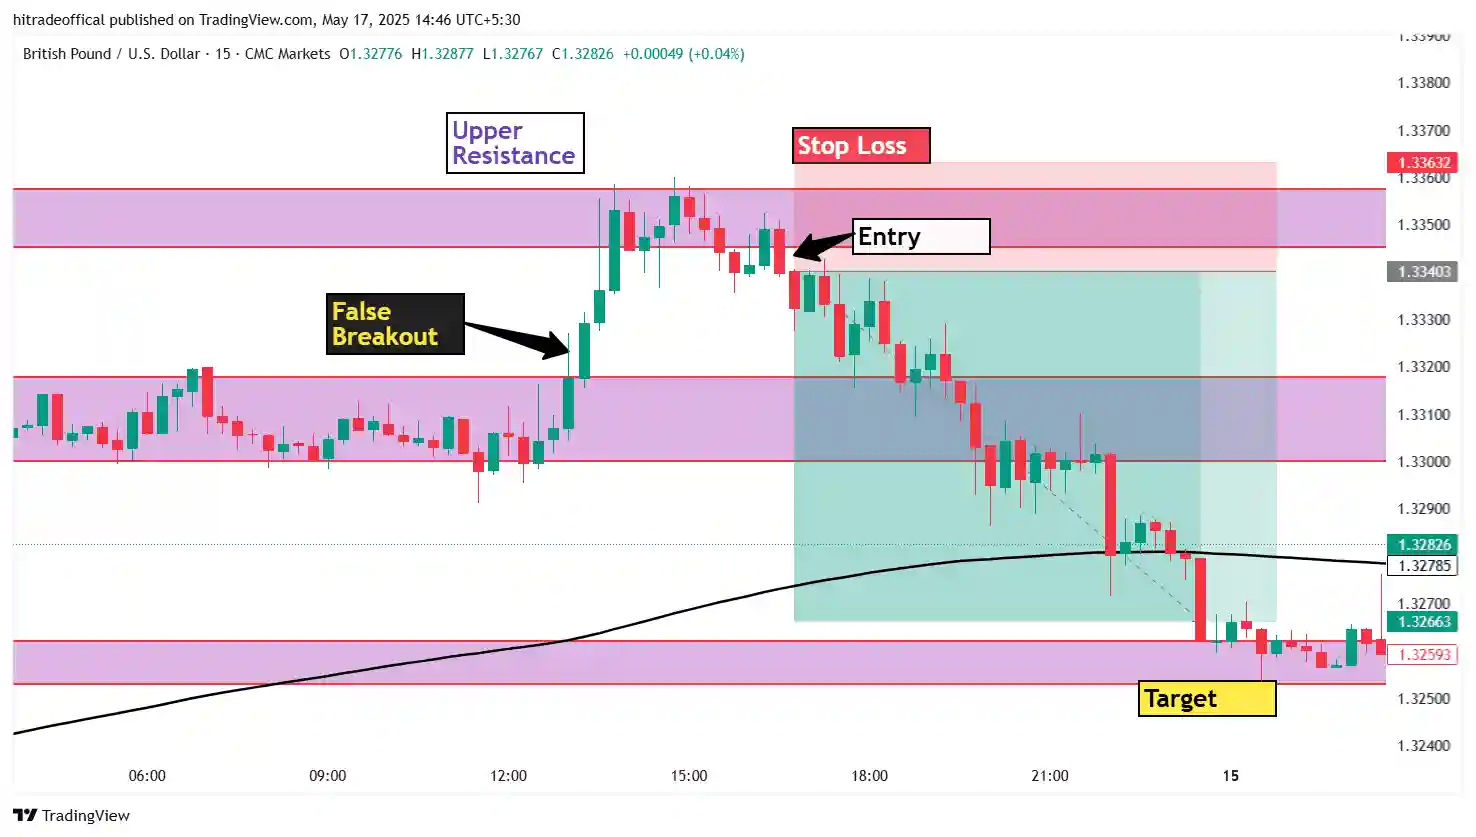
About this image :-
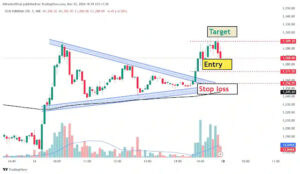
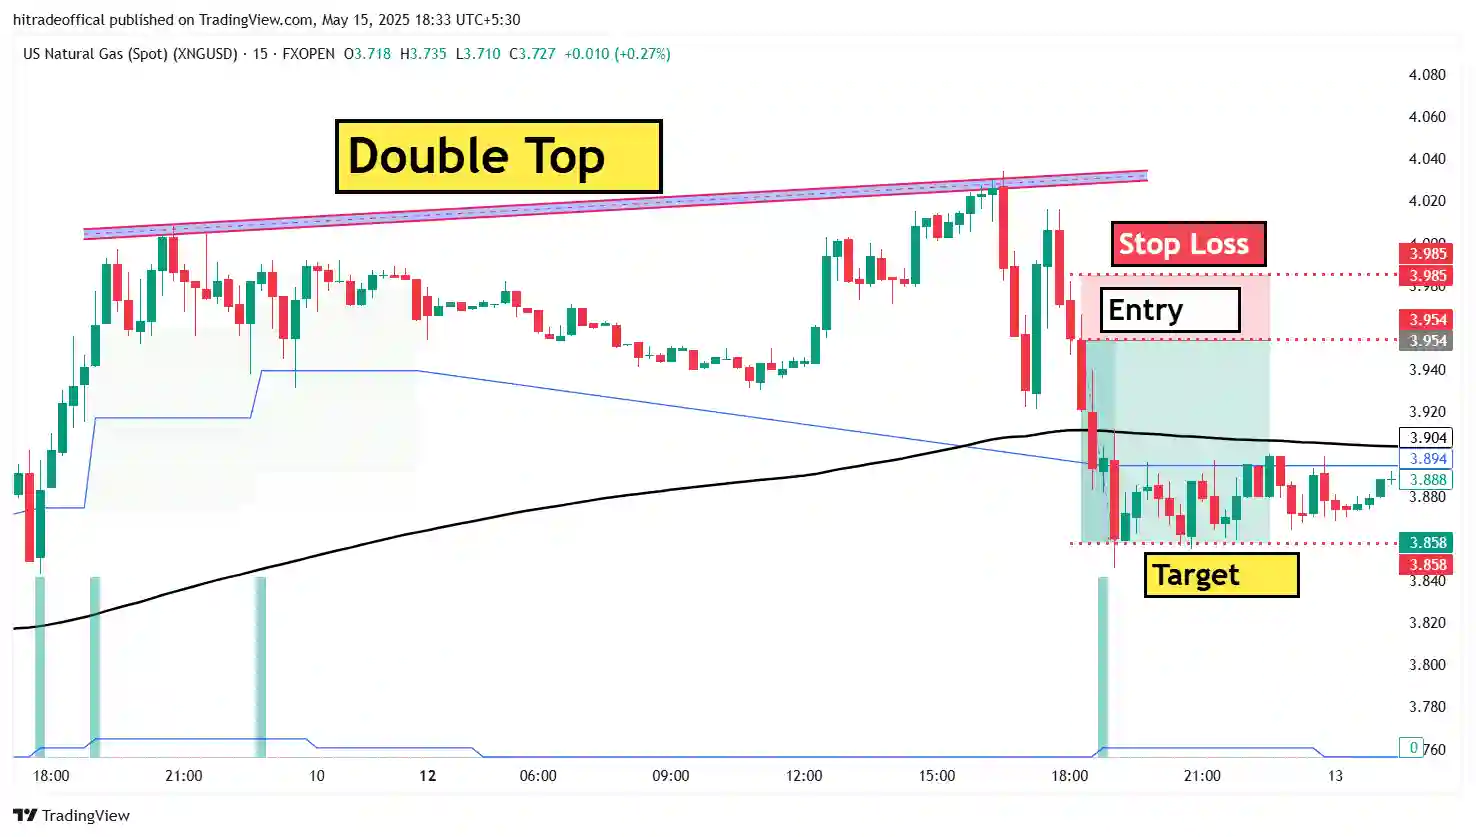
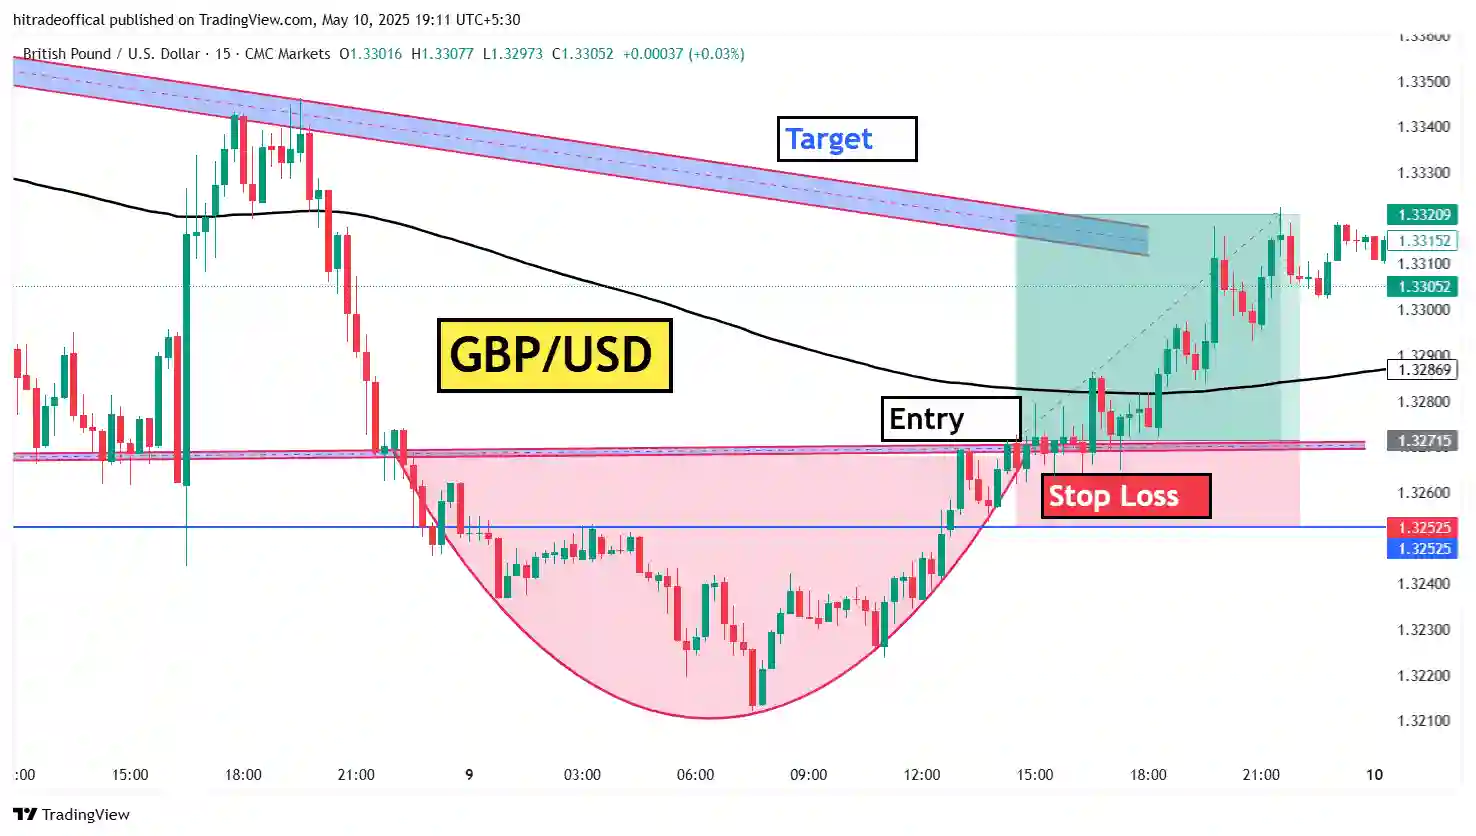
In this image first to first shift our time frame toward 15min and than draw our pattern and than find our entry point as well as stop loss point and target point if you want to learn this thing than you can read our post.
How to draw pattern :-
If you want to draw pattern on chart than you can use some tools like trendline, parallel channel or horizontal line etc. with the help of these tools you can easily draw pattern on chart.
If you are drawing pattern on chart than you can easily plan your trade when we can buy when we can shall.
And due to this pattern your trading is easy and than you can easily identify market as well as you can make profit with the help of these tools.
How to find pattern in live market :-
If you want to find any pattern in live market than you have to do chart analysis as well as see daily chart at least 2hrs.
When you are seeing chart that time see market structure and identify what’s structure is forming and start drawing use some tools on chart.
When you draw pattern than if you are seeing chart on 15min time frame than shift towards 5min time frame for some time and see candlesticks pattern.
This way you can easily find pattern in live market as well as you can also plan your right entry.
What is our entry point :-
In this pattern your entry point level is 1,270 when price touch this level that is your entry but it is a back test so please don’t try to entry now using this level because it is past analysis.
Here, the main thing which is very important for everyone when you are doing intraday trading that time if you are using 15min time frame.
When your price is near to your entry level that time you draw a level and you shift your time frame toward 5min for some time.
Because, some time our entry miss due to time frame so if you don’t want to miss your entry point than you can use this method for good entry.
This way you can plan your entry as well as right entry because in the trading entry is not important right time entry is more important.
What is our stop loss point :-
In this trade your stop loss point is 1,250 when your price reached that level than you can cut your trade. This is a back test trade so don’t try to use this level for now.
Here, The most important thing is measure your stop loss before entry because some time we take trade and than measure our stop loss.
If you follow this process after entry measuring stop loss than some time you have to book more loss so first measure your stop loss than plan your entry.
This way you can measure stop loss and also you can identify your entry is good or not good.
What is our target point :-
In this trade the target point is 1300 level when cross this level your price than you can book your target. But again we are saying this for back test only don’t use this level for now.
You can plan your target using random method like when any stock giving more 10% out of your capital than you can book your target.
This way you can easily define your target point as well as make profit if you follow our all rule like where is our entry point, what is our stop loss etc….
What is the learning of this post :-
There are lots of learning of this post like that
The first learning is what is trending stocks.
The second learning is how to find trending stocks.
The third learning is what is trendline breakout.
The fourth learning is what is the right method of finding stocks.
The fifth learning is which stock is good for trading.
These are the first fifth learning of this post. If you want to learn these things than you can use this title for learning.
