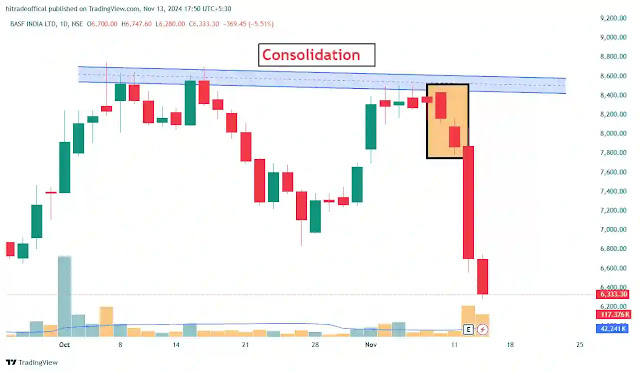
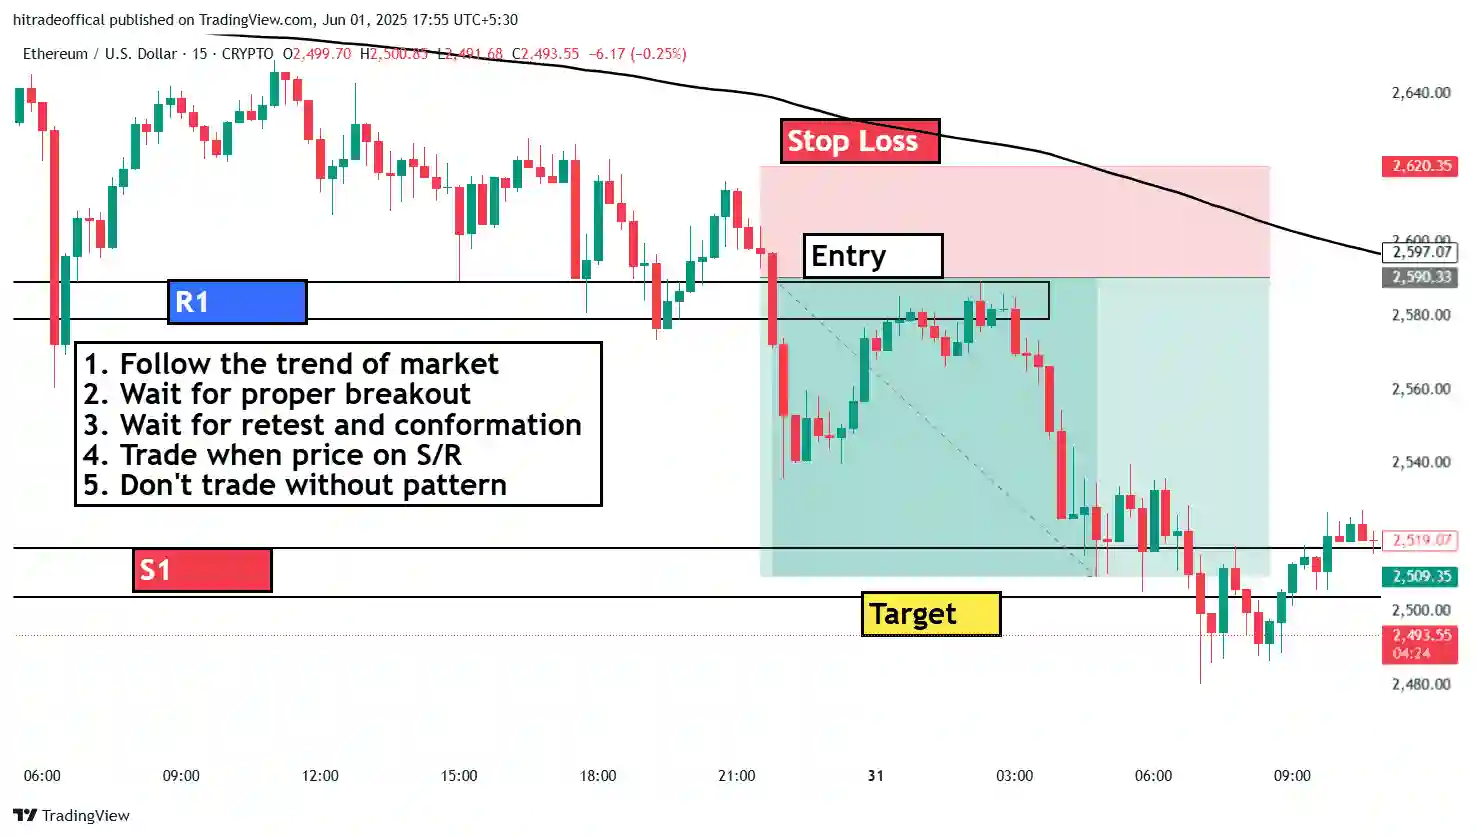
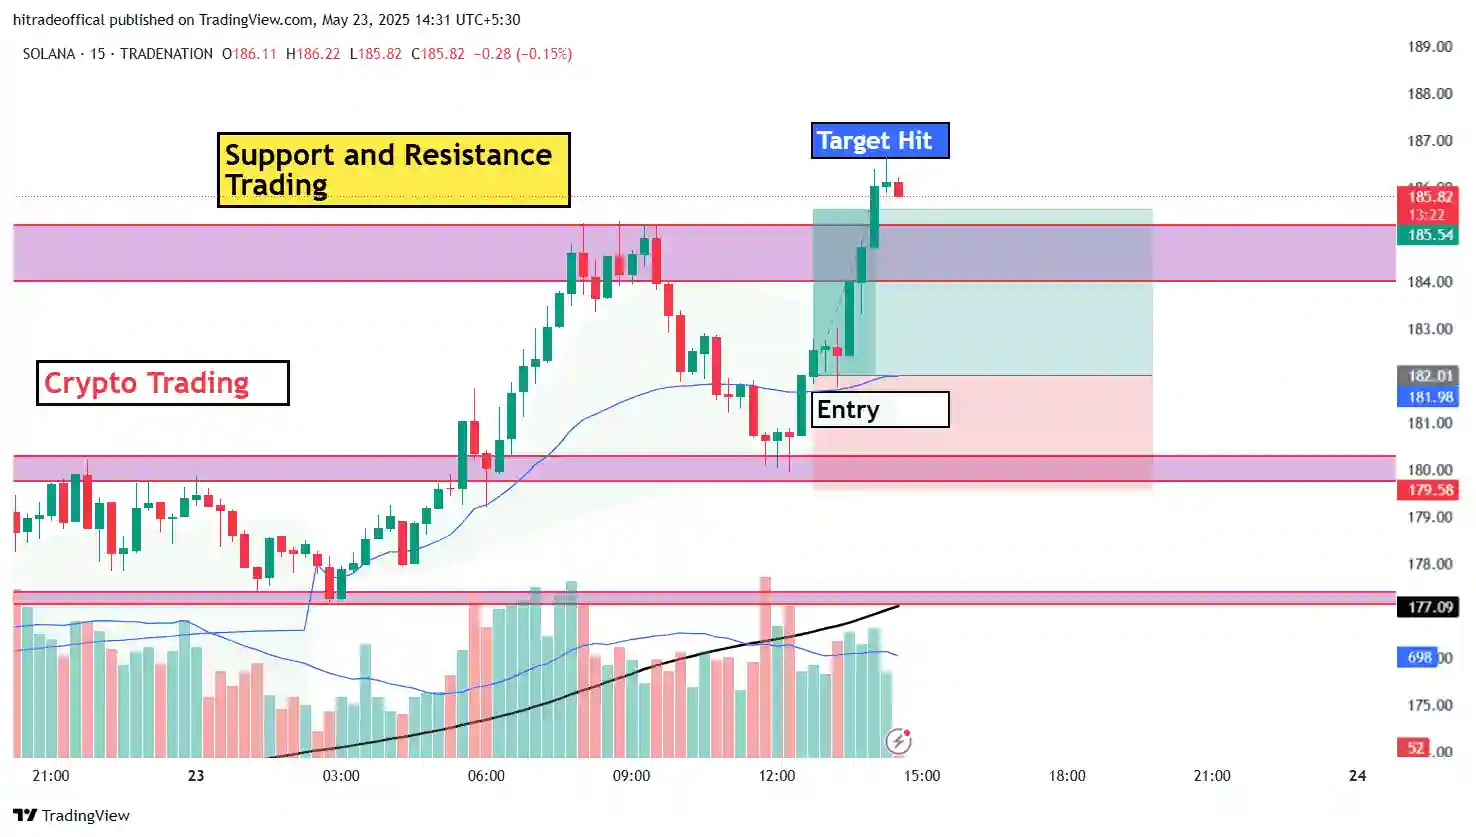
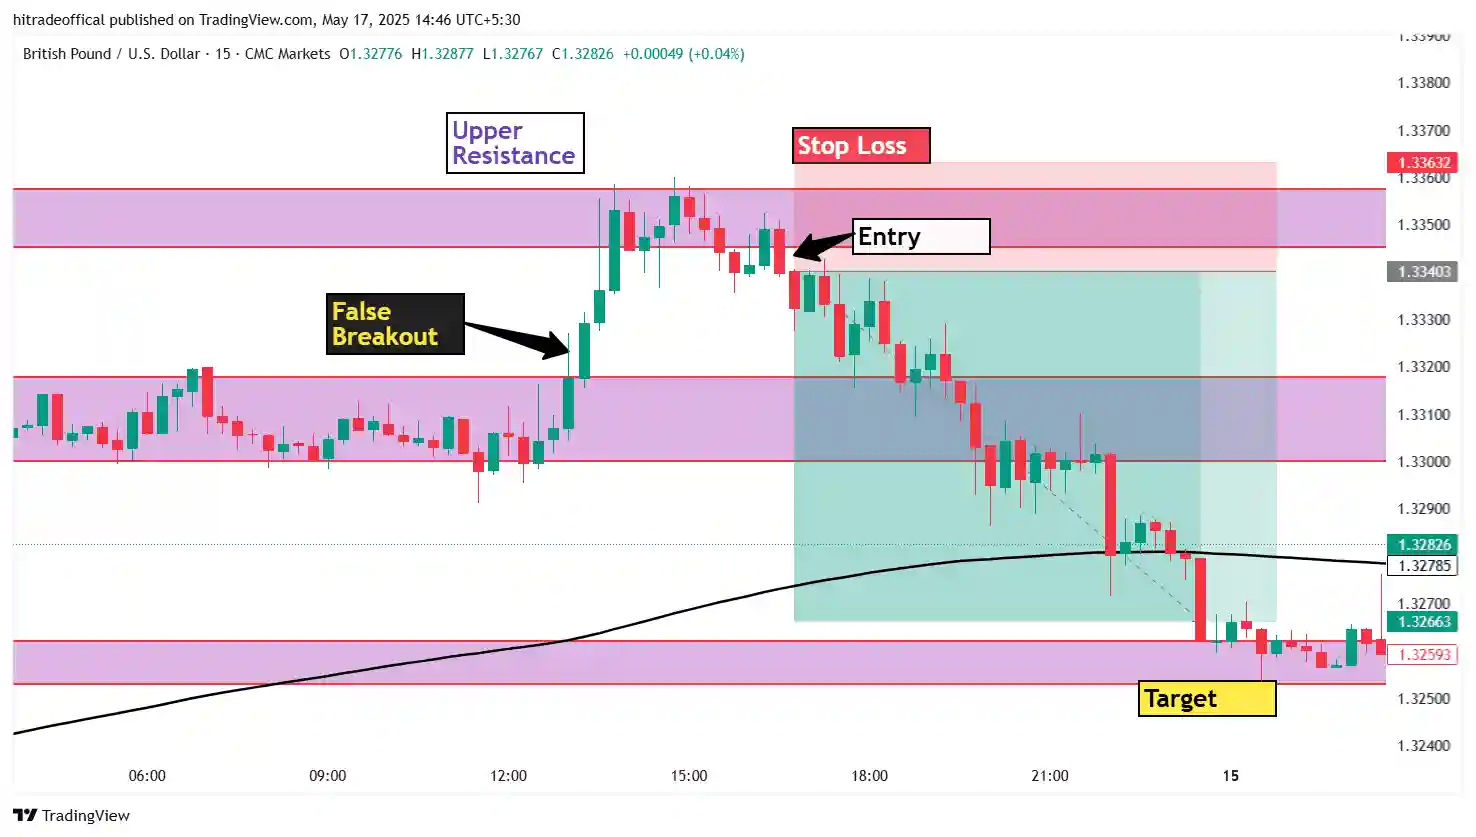
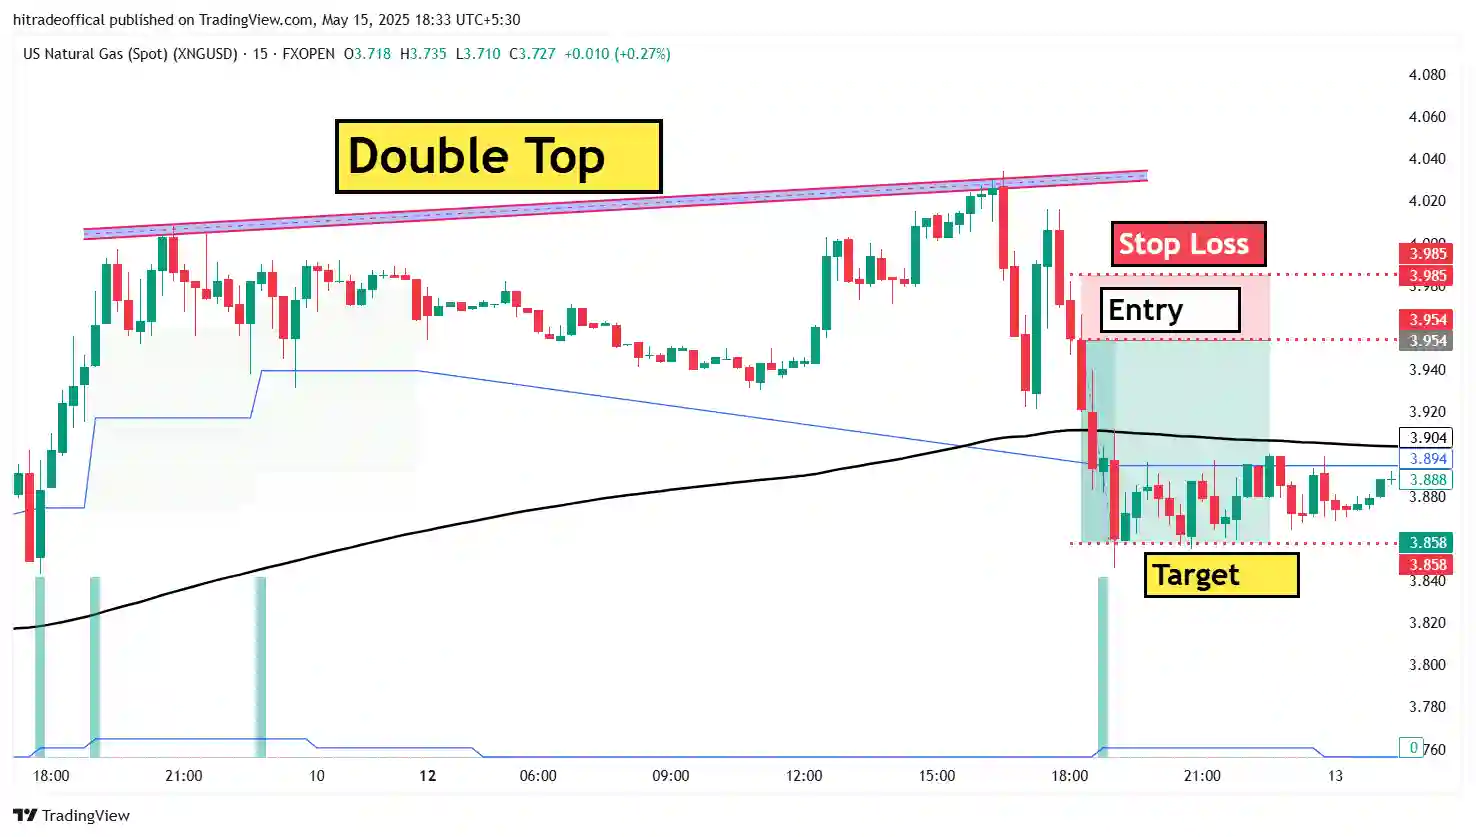
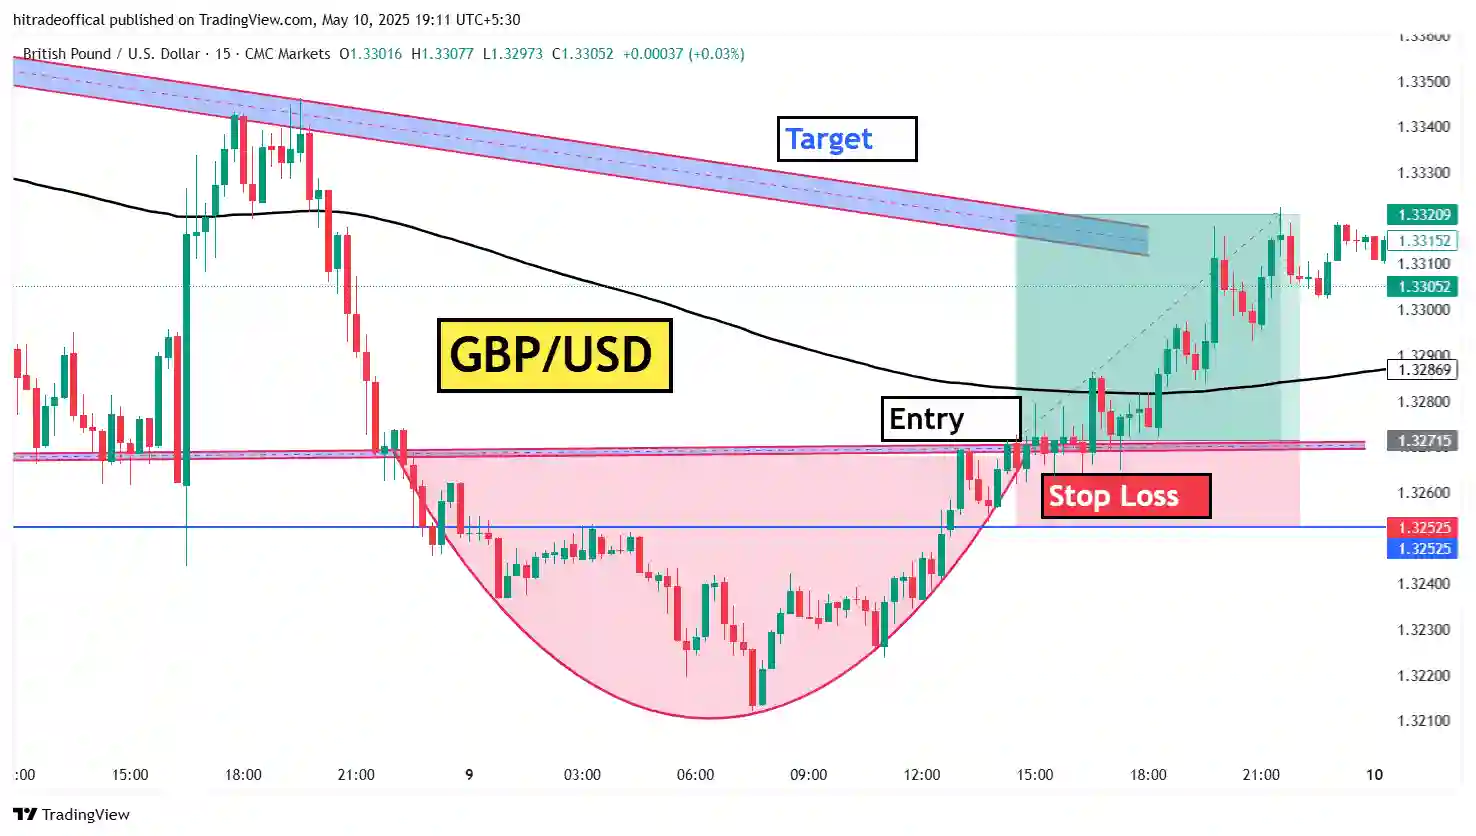
About this image :-
In this image you can see that a bearish chart pattern is form and some time consolidation take place and this is a higher time frame so when we are starting trade that time we shift at lower time frame.
Welcome to this post now keep learning and careful learning.
What is consolidation in trading :-
When any price move in a range or box with low movement this is called consolidation in trading.
In the trading the most important chart pattern that is called consolidation and with the help of consolidation you can easily identify your trend our your trade.
The consolidation is very useful for intraday trader as well as swim trader because when any stock start consolidation in live market than you can mark that stock and using price action you can make money.
What is bearish chart pattern :-
When chart make some pattern and after some time market start falling due to this chart pattern than this chart pattern is called bearish chart.
When any stock form bearish chart pattern than you can go towards in sell side because in maximum time market fall if chart make bearish chart pattern.
Our first post image you can see that a bearish chart pattern is form and due to this bearish chart pattern our price start falling and with in some candle you can see that more than 15% fall price.
This is called bearish chart pattern. And in this title we also cover use our bearish chart pattern so you can learn all thing in our post.
How to find bearish chart pattern :-
If you want to find bearish chart pattern than you can follow some steps :-
The first step is open your top 500 stocks list in your trading software.
The second step is start scanning those chart which is form bearish pattern like our image.
The third step is when any stock form bearish chart than mark it.
The fourth step is see always this mark stocks.
The fifth step is if any movement is form in down side than you can say that it is a bearish chart.
This is the five step with the help of this you can easily find bearish chart pattern in live market. If you want to know full knowledge than you can learn our whole post.
How to test bearish chart pattern :-
If you want to test your bearish chart pattern than it is very good for you because in this time there are lots of trap making pattern and also due to trap there are lots of traders booking only losses.
So, if you want to avoid loss than the test of bearish chart pattern is very need so in trading there are lots of method to test any chart pattern.
The first testing method is called back testing if you are trader than you know in trading field back testing is very important and with the help of back testing you can also test your chart pattern.
The second testing method is waiting because in this time you know trap so if you want to avoid it than wait for first movement and when second movement is form than you can trade.
This is our some method with the help of this you can easily test bearish chart pattern in live market.
What is the best time frame for trading :-
If you want to know the best time frame for trading than its answer is that is depend upon fully your trading style and your trading type.
Like that if you are doing swim trading than 1hrs, 2hrs, 1D and 1W this time frame is best for your if you are focusing on swim trading.
If you are doing intraday trading than 5min, 15min and 30min time frame is best for you if you are focusing on intraday trading .
If you are a scalper than 1min, 3min, and 5min time frame is best for you so now you can easily identify what is the best time frame for trading.
This is the chart of same stock in lower time frame :-
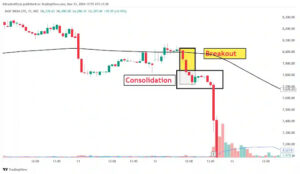
About this image :-
In this image you can see that first to first our breakout is form and after some time consolidation is start than price start falling. In this time there are lots of trader which have no patience so when breakout is not completed that time he is starting his trade.
What is breakout in trading :-
When our chart or price making some pattern and price suddenly break this pattern or consolidation this is called breakout in trading.
In trading on the basis of breakout we can buy or sell any stocks and also using breakout we can easily trade in live market and make profit.
This is the whole information of breakout in trading but only two steps we can not know what is breakout but it can know what is breakout in two steps.
How to find breakout in live market :-
There are lots of method with the help of you can find breakout in live market in this post we also take some methods.
The first method is start chart analysis and finding pattern during finding pattern you can draw some pattern like our post image and when price break this chart pattern than you can say that breakout is form.
The second method is price movement when price suddenly give big movement than you can say that any breakout in form in live market.
This way you can find breakout in live market and with the help of this you can easily make money.
How to test our breakout, Is it real or not? :-
If you want to test your breakout is real or not than you can follow our some method.
The first method is don’t trade on first breakout when you follow this line in live market than you can easily test your breakout is real or not.
The second method is when breakout is form that time see price action and match it if breakout direction and price action movement both are same than you can say that your breakout is real.
This way you can test your breakout is real or not if real than you can trade and if fake than you can avoid your losses.
How to plan our trade in this pattern :-
In this pattern if you want to plan your trade than this is very good for you because in this pattern your risk is very low and your reward is very good so you can plan with the help of following steps.
The first step is find this type of pattern when you find this type of pattern than mark it and see daily.
The second step is draw pattern on chart and wait for breakout.
The third step is don’t trade on first breakout because may be the first breakout is trap.
The fourth step is after breakout wait for consolidation if consolidation take place than you can trade.
These are some steps with the help of these you can plan your trade in this pattern.
This is the chart of same stock for intraday trading :-
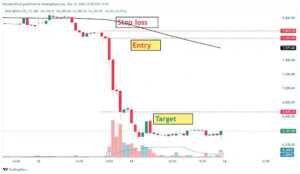
About this image :-
In this image we draw first to first entry point and than stop loss and than target point you can use trailing stop loss for good target.
What is our entry point :-
After breakout wait for some candle and price action but if you are doing intraday so there are no need for any price action after breakout but still you can wait for 2 more candle.
When 2 more candle form or in this image after breakout some consolidation take place after some consolidation a price action also form than you can enter this stock.
In number our entry point is 7,715 is our entry point for this stock and this is past analysis so don’t try to use for instant trading but you can follow this process for trading.
What is our stop loss point :-
In this stock our stop loss point in number which is 7,820 this is our stop loss point.
And if you want to make constant profit using trading so don’t forget stop loss and you try to before entry one time measure your stop loss.
When you measure your stop loss that time you can see in this trade you can get money losses and if losses is your range than you can trade otherwise you can avoid this trade.
What is our target point :-
When you are plaining your target than you can use three methods.
The first method is random number like that I want profit 10% out of my capital. This is also a way for booking target.
The second method you can use near support or resistance. You can use nearest line like that when you start drawing support or resistance that time which line is near your nearest toward target this is your target line.
The third method is very useful and making more profit as compare to other method this method is called trailing stop loss with the help of this you can make more profit as compare to other methods.
Learning of this post :-
There are lots of learning in this post like that you can learn title by title.
The first learning is what is consolidation in trading.
The second learning is what is bearish chart pattern.
The third learning is how to find bearish chart pattern.
The fourth learning is how to test bearish chart pattern.
The fifth learning is what is the best time frame for trading.
This is the first fifth learning point. If you want to learn these whole things than you can use these title and for more learning you read our whole post.
