About this image :-
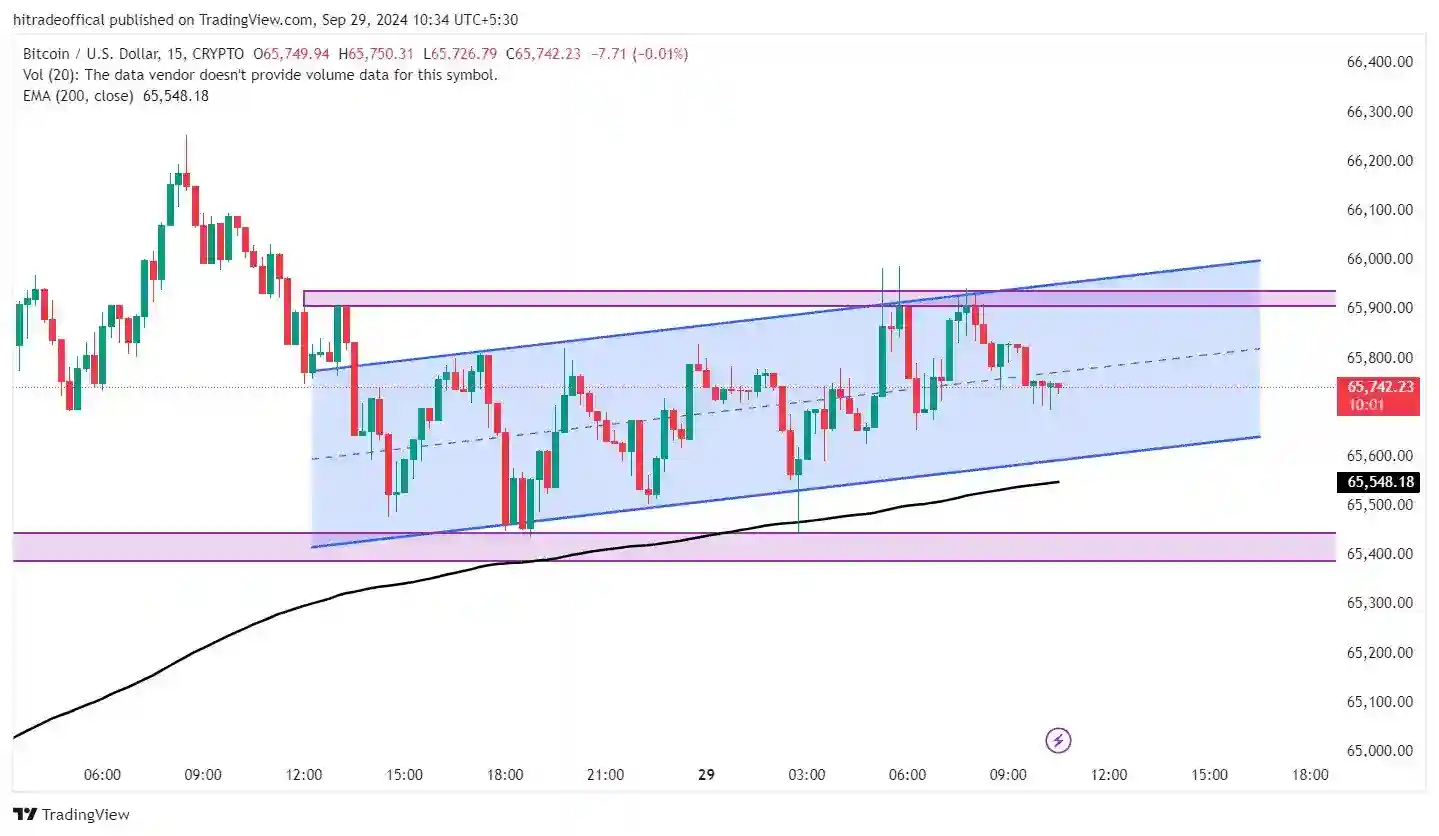
This is the image of bitcoin chart as you can see this and in this image we draw a support and resistance and today in this post we analysis bitcoin and its chart. Welcome to this post now keep learning and careful learning.
How to analysis chart :-
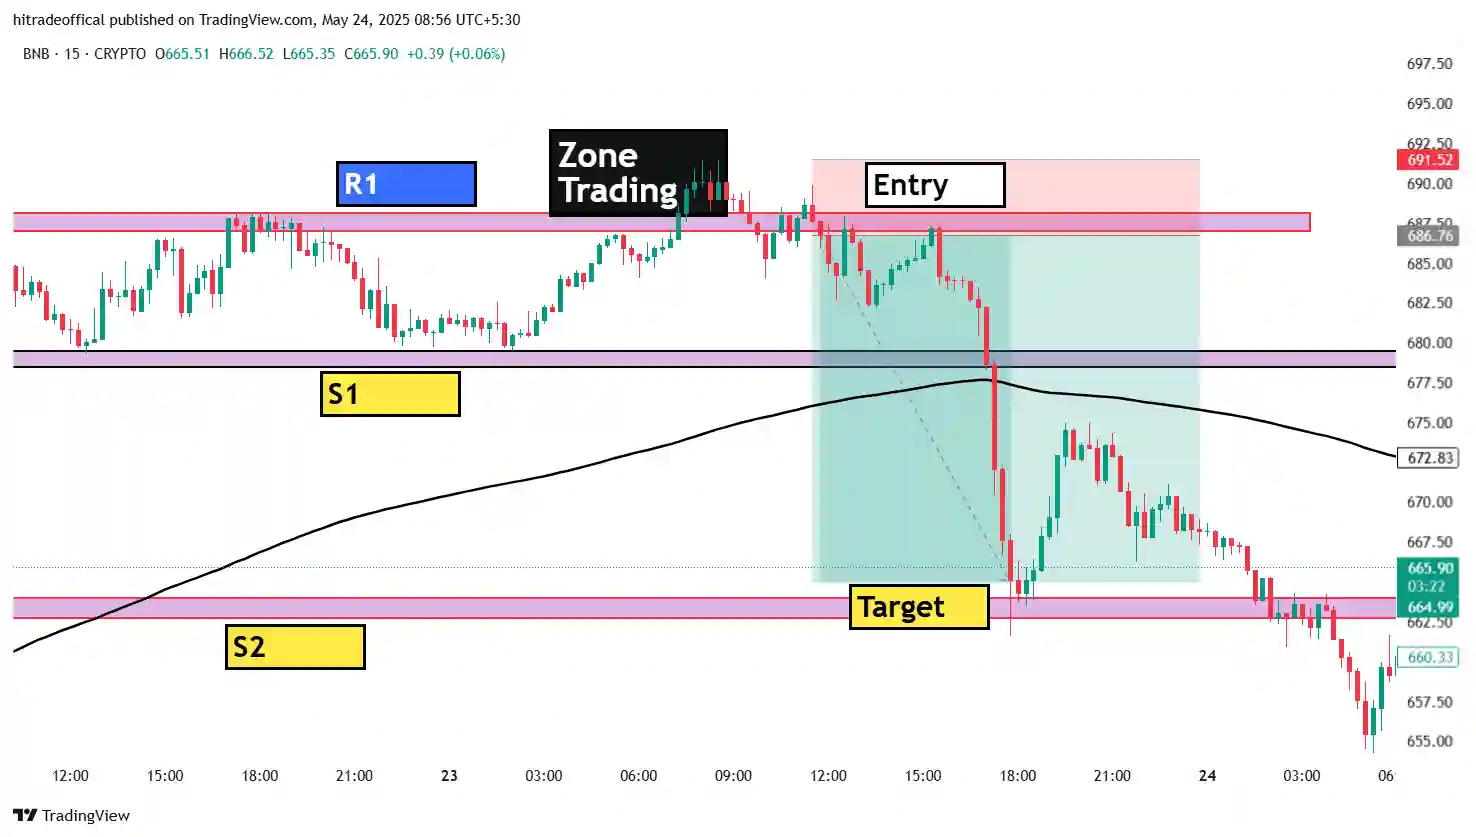
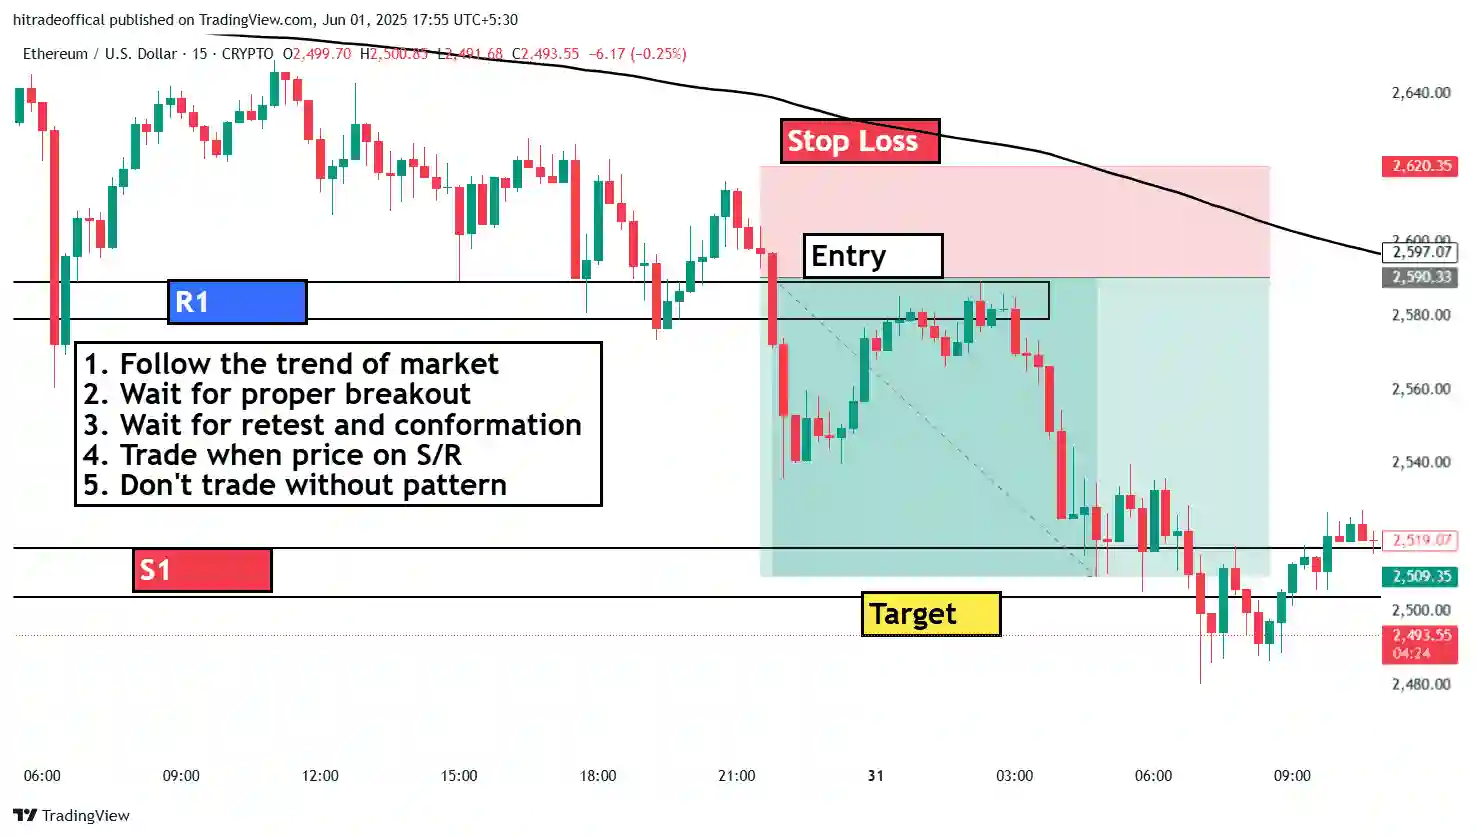
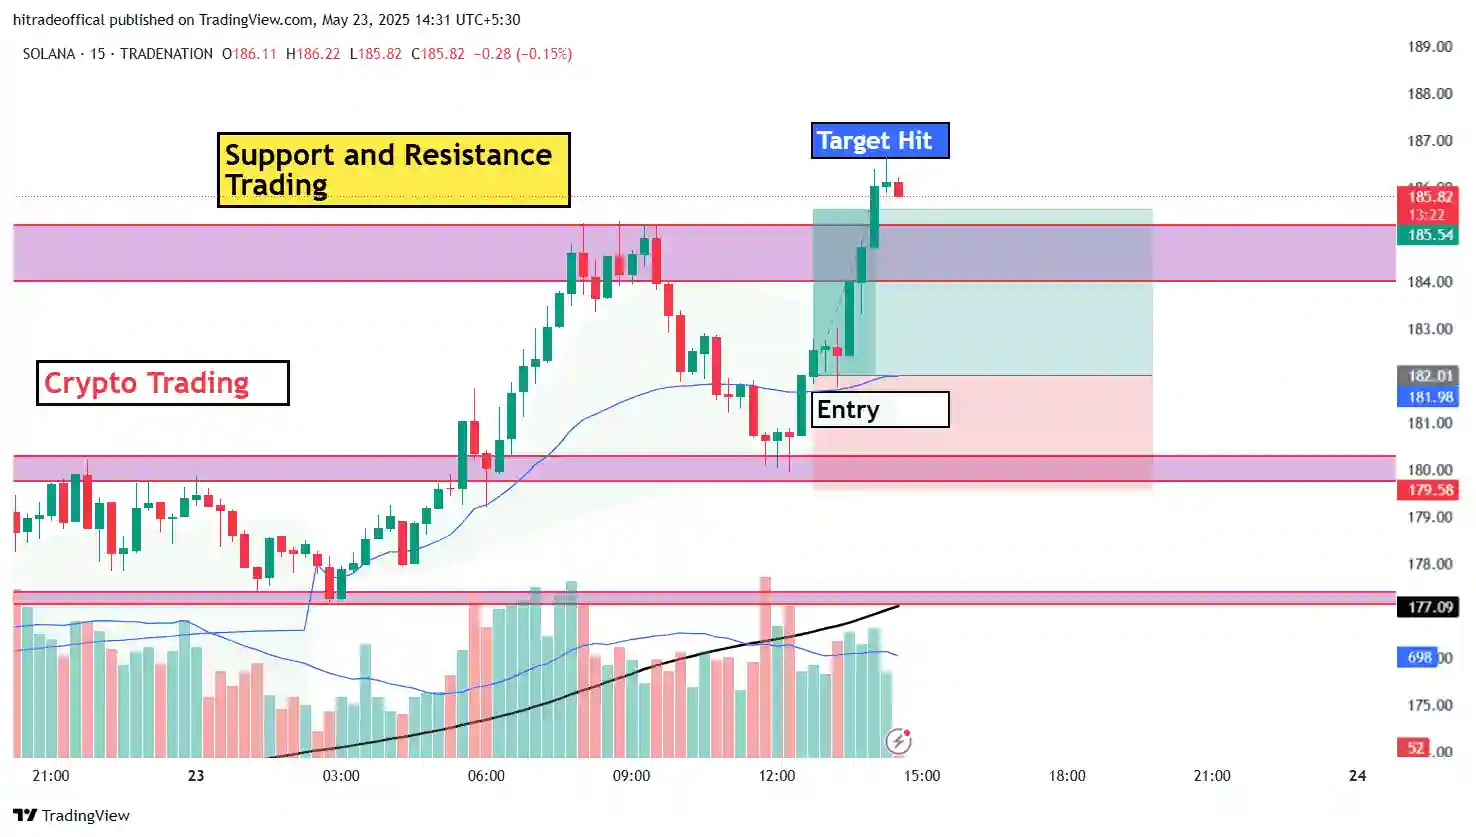
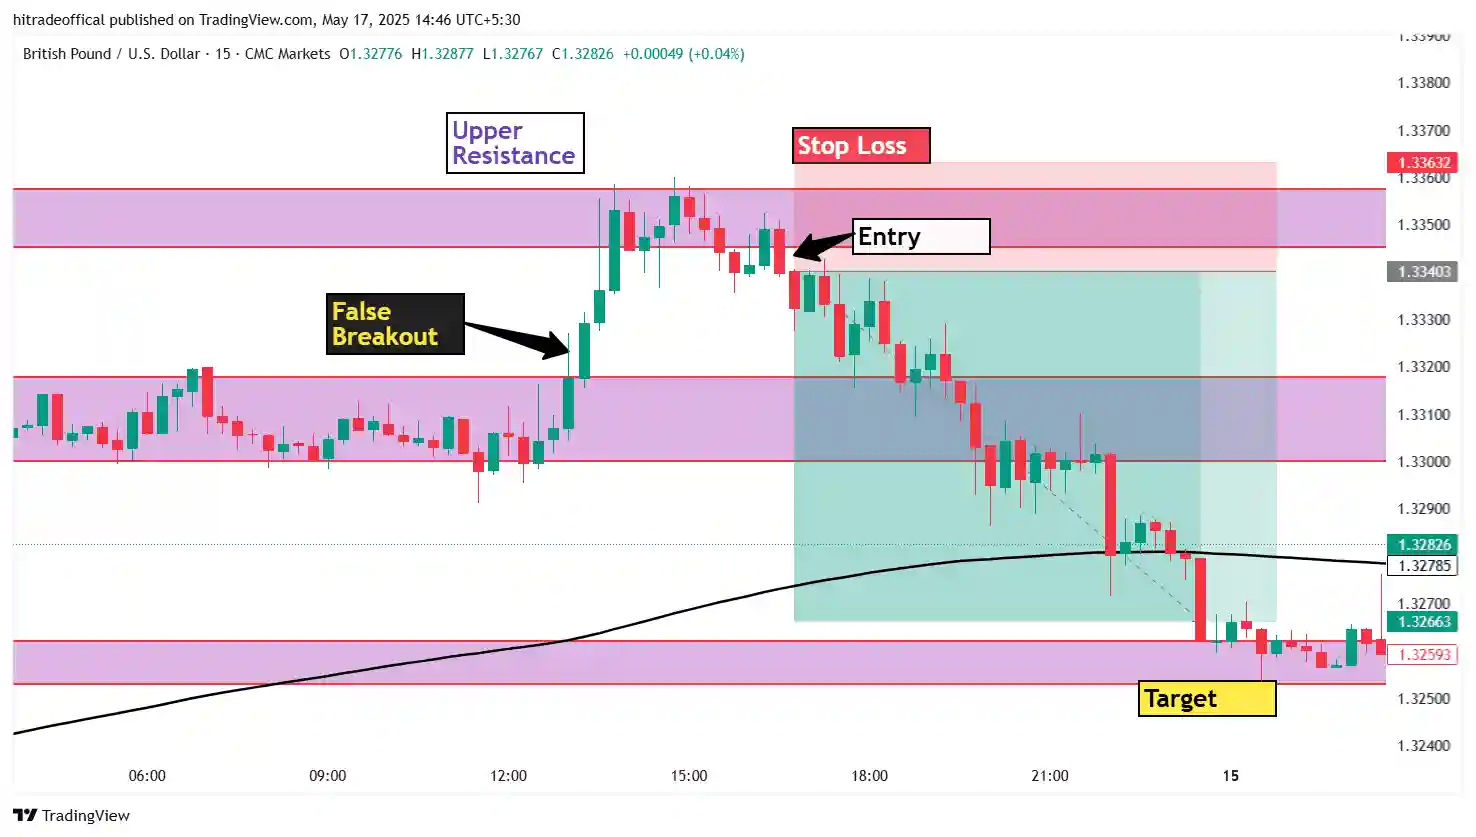
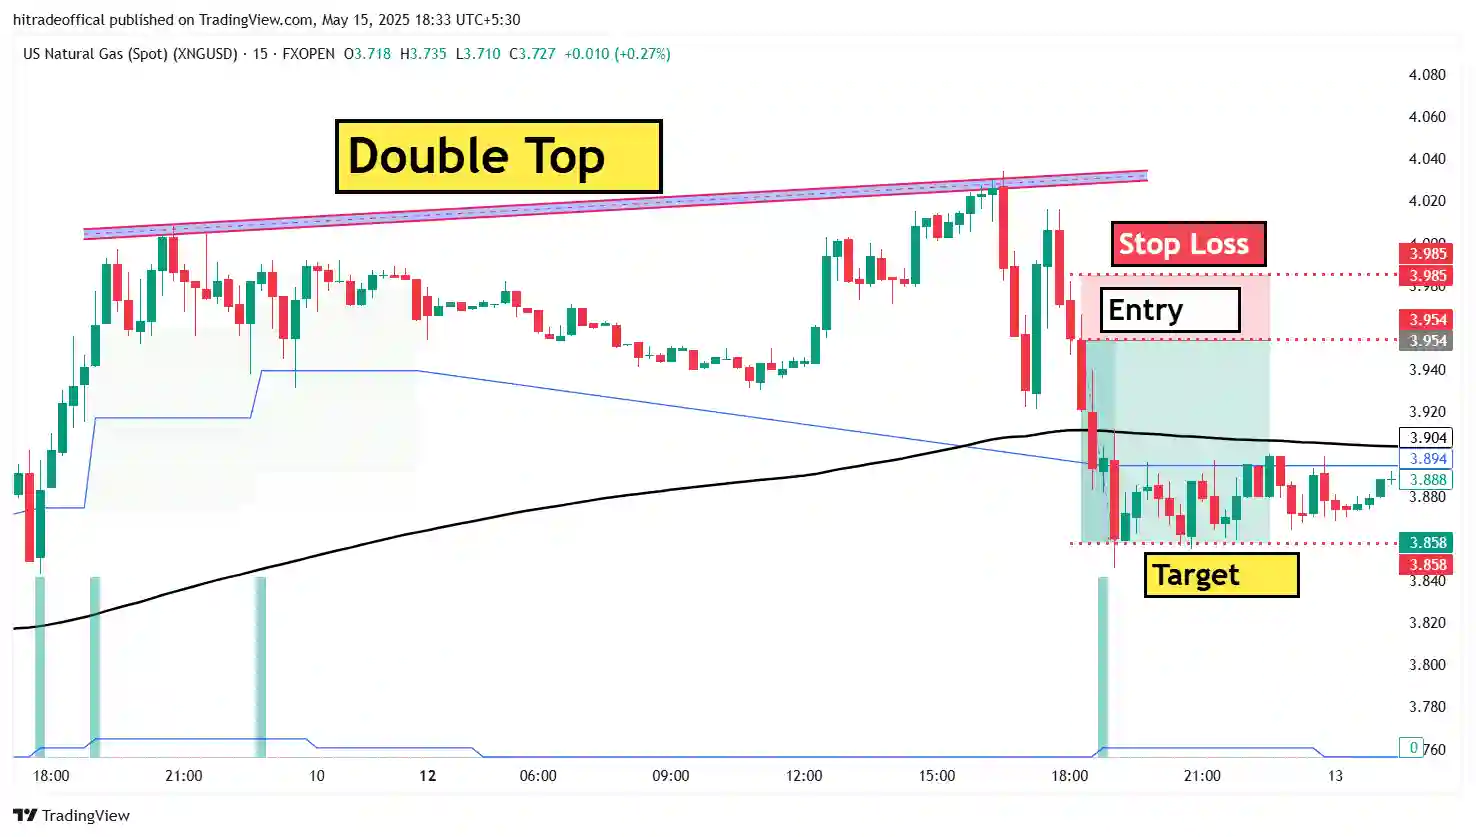
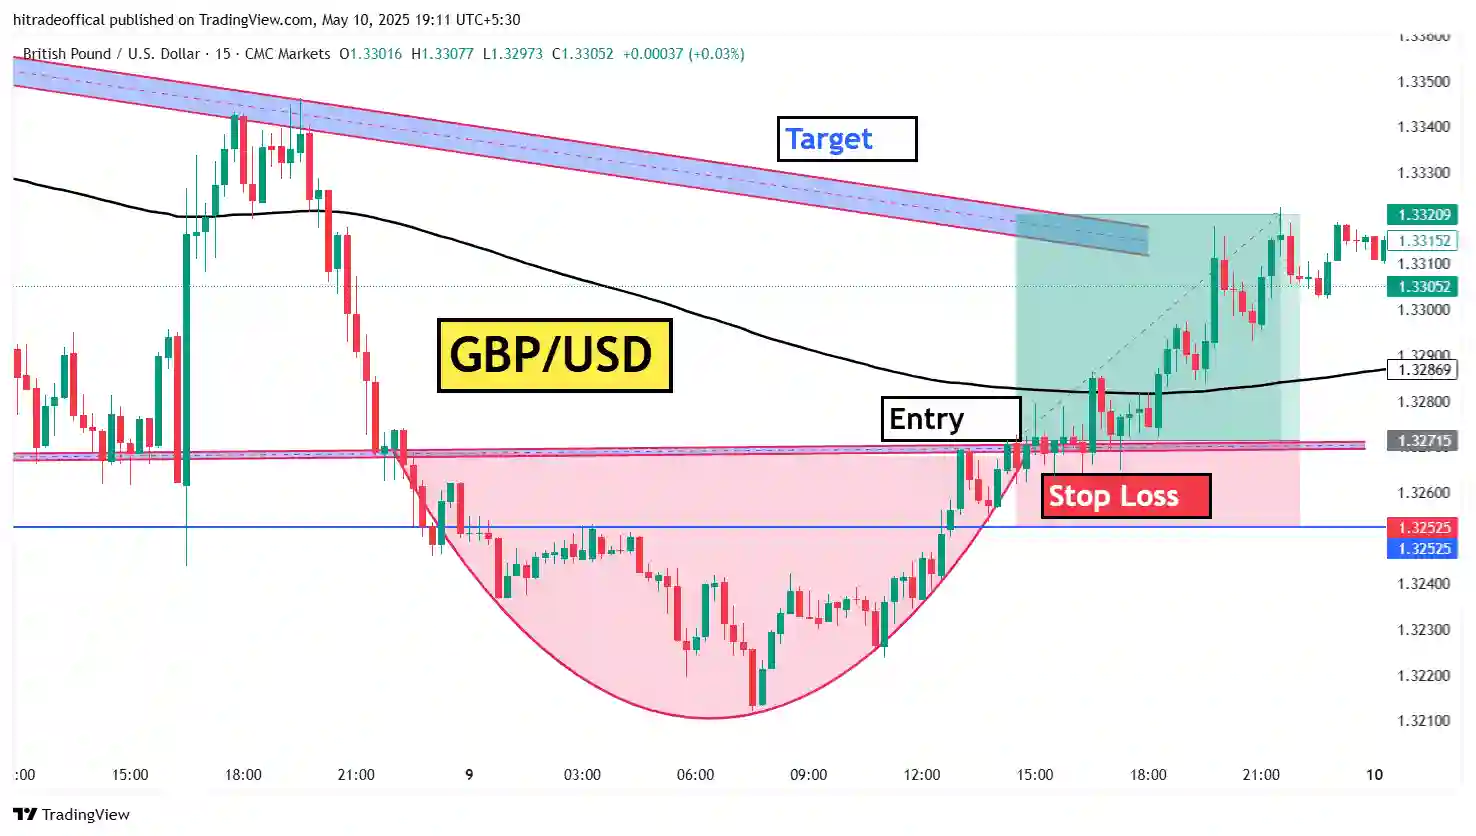
If you want to analysis any chart than you must need to draw a support or resistance and you can also take help for any indicators like that moving average and VWAP and volume and RSI and ema etc. and than try to draw support or resistance in form of zone not a line like that in this image you can see this we draw a support or resistance in form of zone not in line. Now you need to wait for price action wait for any price action when any price action is form than you can take trade also you can wait for price when reached near support or resistance that time maximum price action is form. This way you can analysis any chart.
Today’s bitcoin support or resistance :-
Today our support is 65,400 and near this price and our resistance is 65,900 and near this price this is a range for today’s support or resistance you can focus and you can also draw a zone in this price and than wait for any movement and than also wait for any price action and remember our golden rule and our golden rule is don’t trade in the first breakout or breakdown remember this rule and you can wait for any first movement and than if any price action is form and than measure our stop loss and than our stop loss is our range than we can take trade in any direction. This is the today’s support or resistance for bitcoin trading.
How to work price action :-
This answer is price action work on the basis of chart pattern and candle sticks pattern so you need to learn chart pattern and candle sticks pattern and when you learn these thing than you can easily identify any price action and than with the help of price action you can easily buy or sell and stock with 100 % surety and you also need to practice because without practice you can’t buy or sell with confidence so first to first start your learning chart pattern and candle sticks pattern and than you try to see daily chart al least 2 hrs. and than use in small amount in trading and start trading with small amount and start trading and don’t focus to earning you need to focus on only learning. If you learn more than you can earn more. This way our work our price action also this way you can learn price action.
Learning of this post :-
In this post there are lots of topics for learning like than you need to learn how to draw support or resistance and also you need to learn how to work support or resistance and you need to learn how to test our support or resistance is this working or not and than you need to learn what is price action and how to work our price action and than you must need to learn what is chart pattern and how to work chart pattern pattern and also you need to learn what is candle sticks pattern and how to work our candle sticks pattern. These all things are for learning of this post.
Thank You for this post and for more update you can follow on YouTube channel
