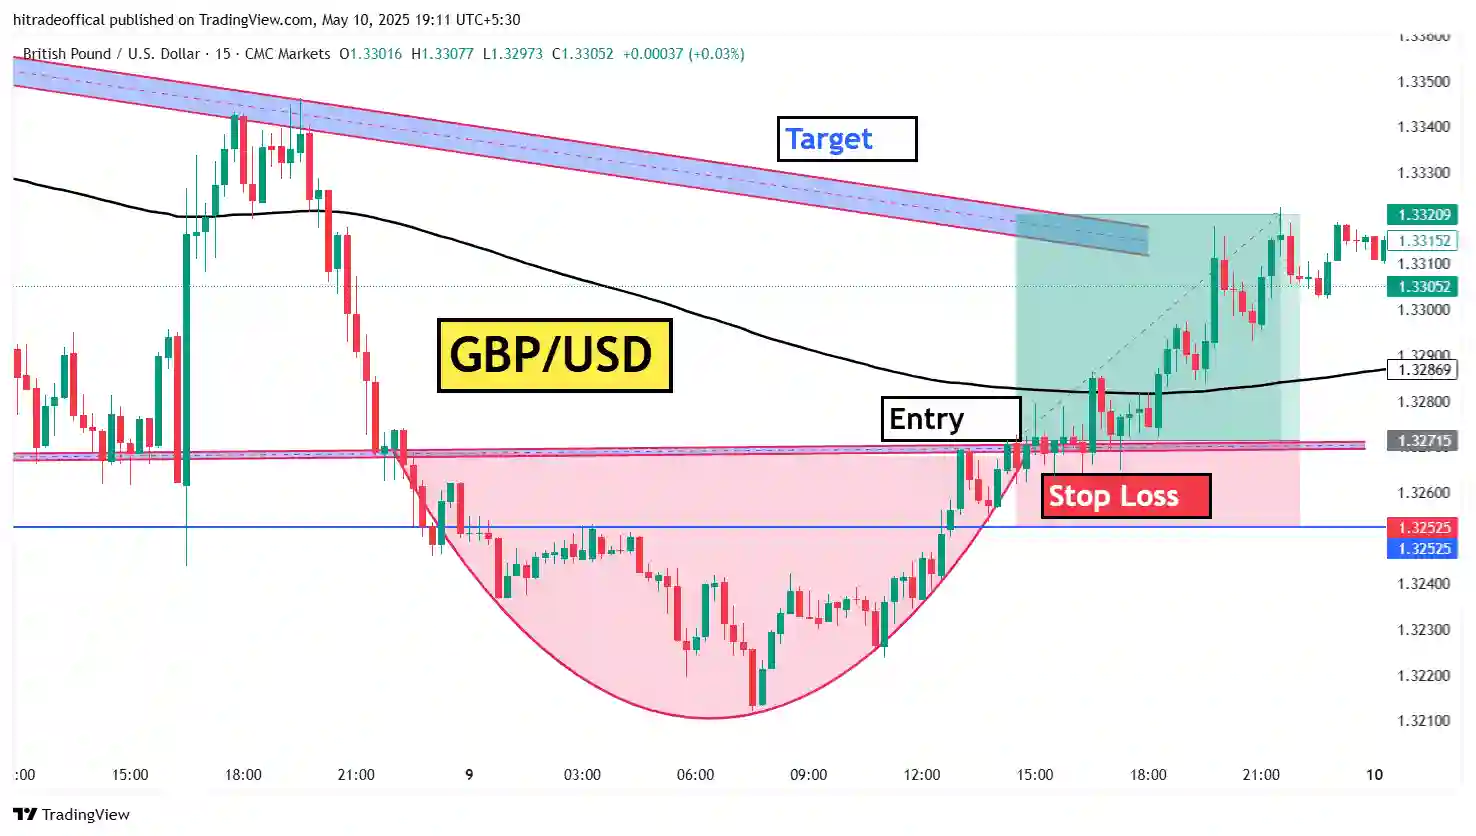
About this image :-
In this post we learn about how to trade on double top trade and than how to identify the double top and when our target hit. These are some topics we cover in this post.
How to identify double top:-
First to first if we have to identify doble bottom than we need to see chart and than find which chart form two top means two a place in which place two time price did reached. If you have any chart than see our rules if our all rules will follow in that chart than it is double top or double bottom. This way you can easily find double top in any chart again if you have any doubt in this topic than you can see our every image and also you can send mail about this topic.
When we can execute our trade :-
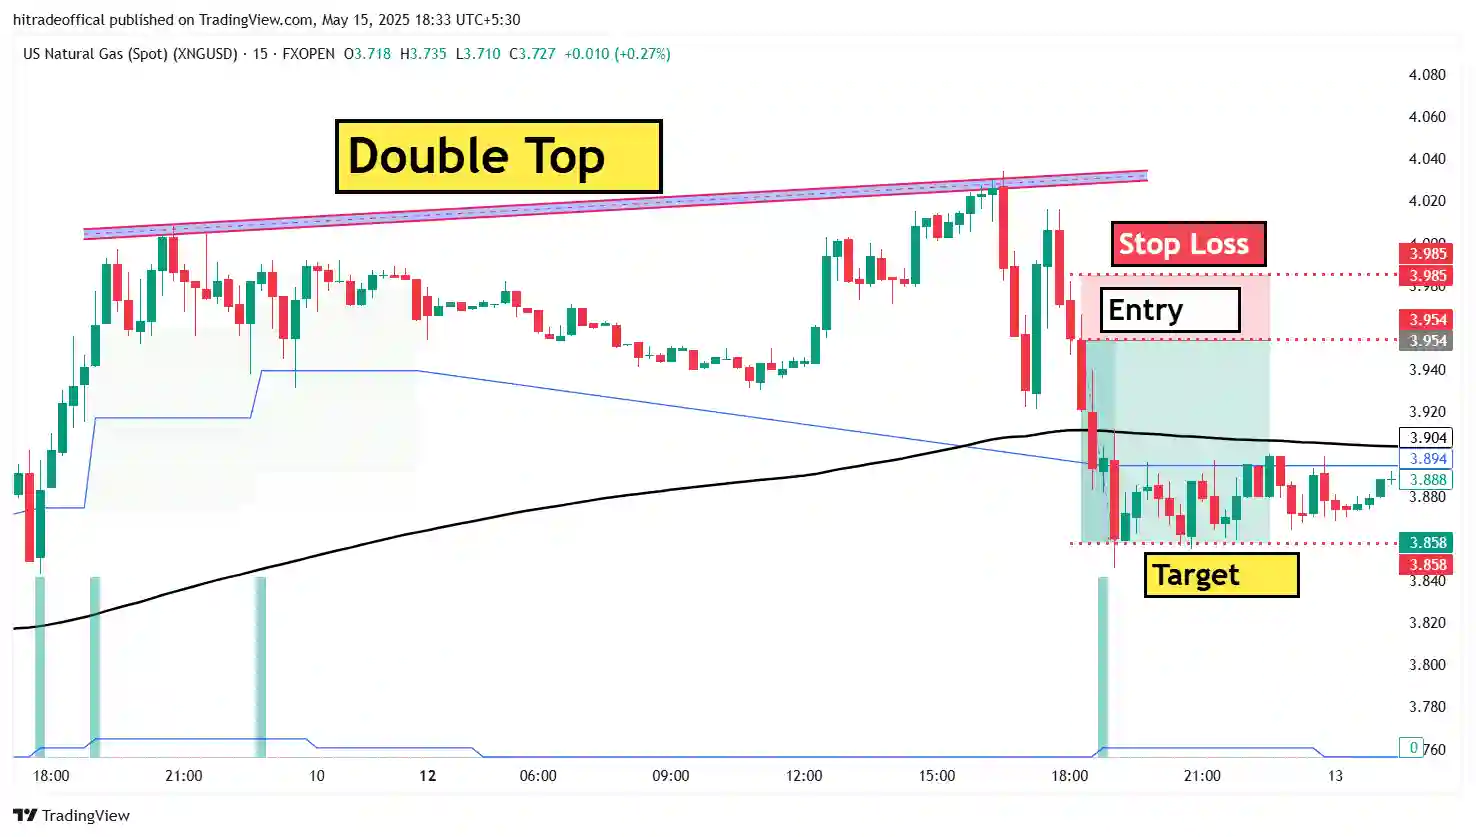
The answer is that in this pattern we can wait for two conformation like than you can see this image in this image we drawn two line the one line in upper side and the second line is lower side and than our double bottom is form and than only one conformation is obey but only one conformation we don’t trade in this pattern so we need to wait our second conformation the our second conformation is our lower trend line when our lower trend line is break in lower side than our second conformation is obey than we can execute our trade on this pattern. This way we can execute our trade.
Which indicators is need for trading :-
In our trading life indicators is not very useful because the indicators work are only indicating not trading that means if you are in new our trading field than we can use only some indication like that ema, moving average, vwap, volume, adx, rsi, etc. but when you are old in trading field than you can fill the indicators is not useful our trading but in this time you can try only one time 2 or 3 indicators not more indicators and also you need to learn indicators because if you don’t know how to use indicators than may be this is bad for you may be losses is day by day increase so first you learn use of indicators. This is the perfect answer of this topic.
How to trade in this pattern :-
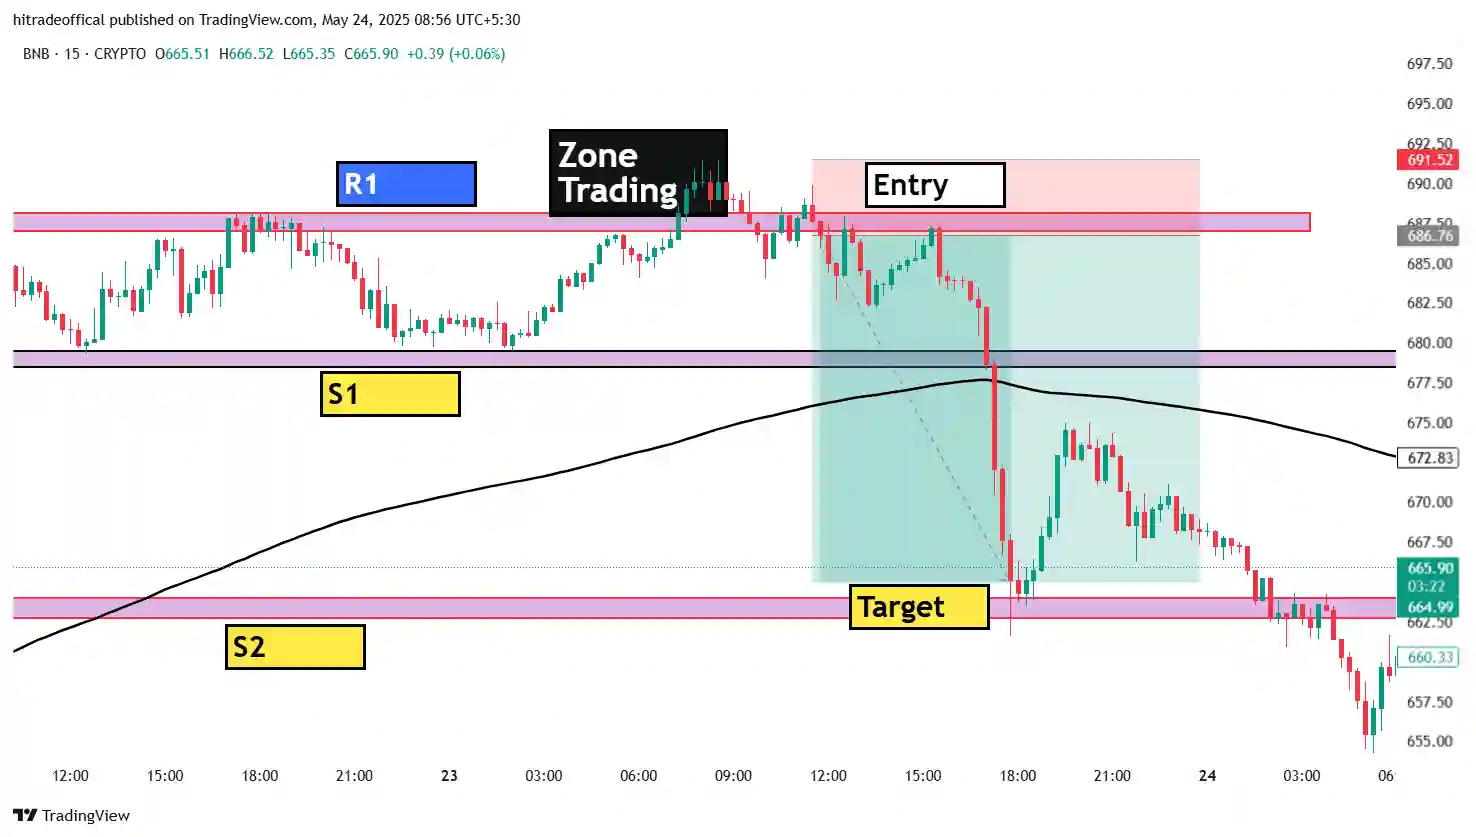
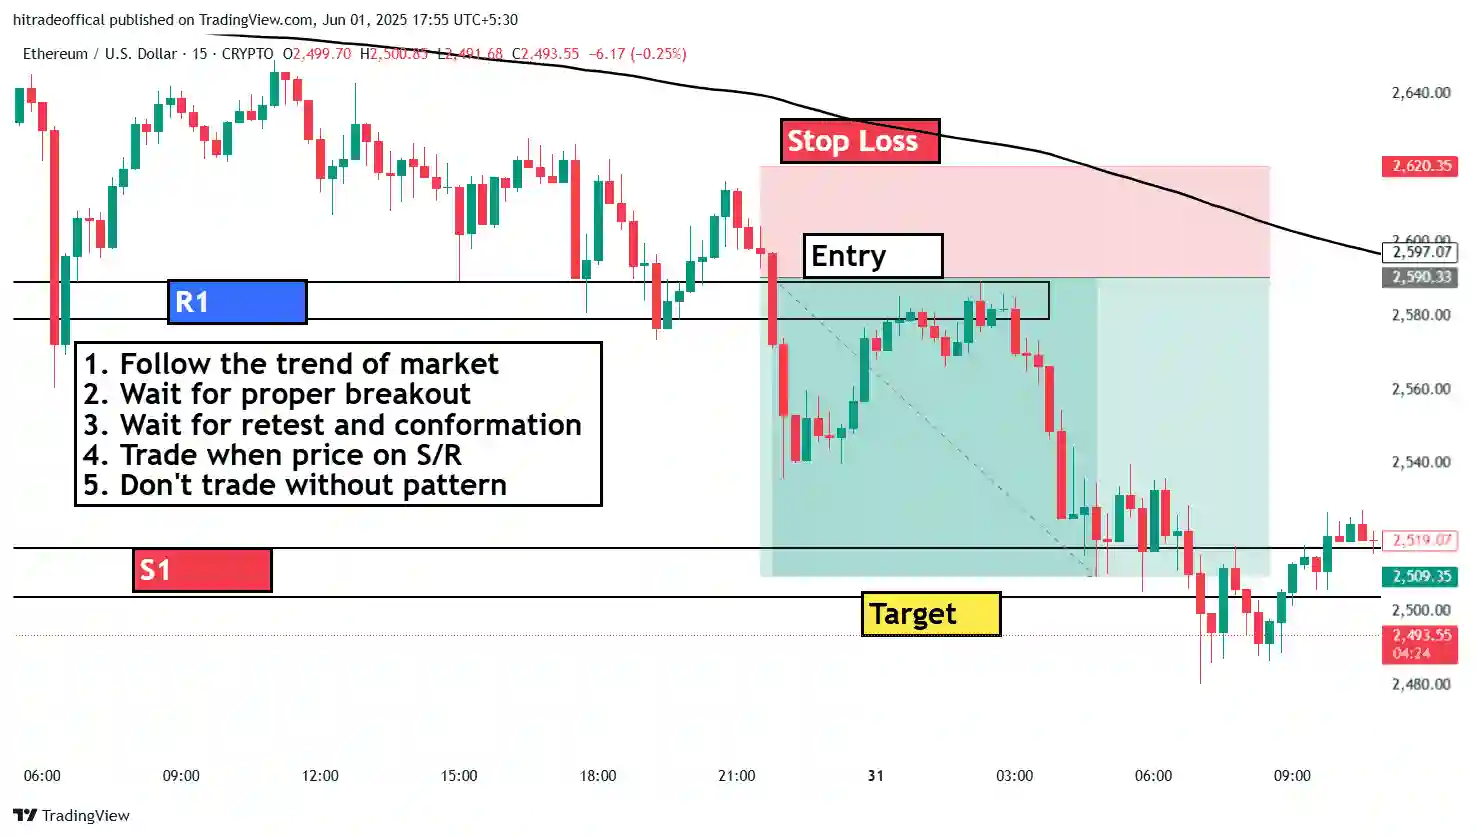
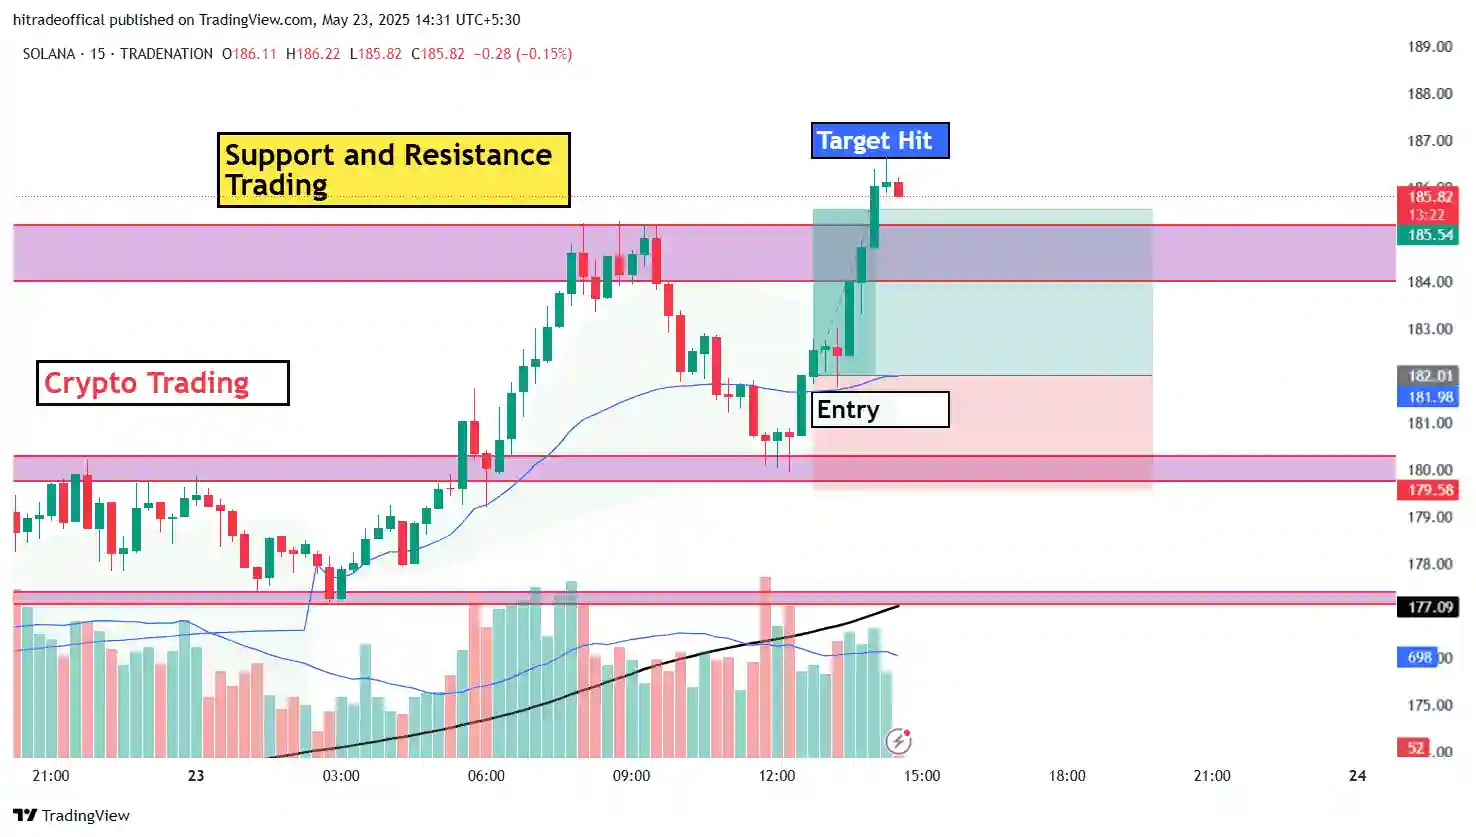
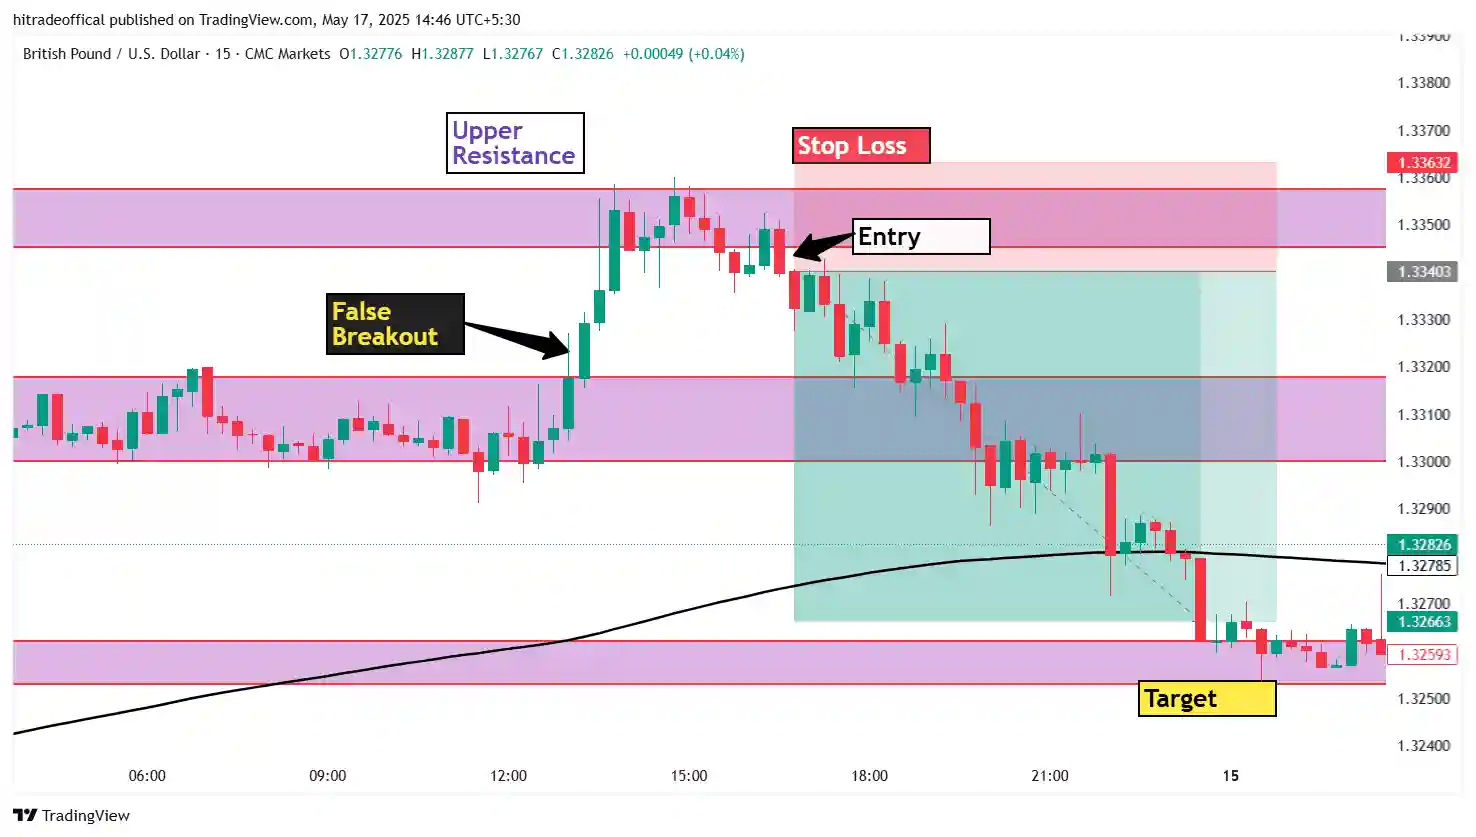
First to first you see today post image in this image you can see I use only two indicators the one is ema and second is volume and than you can see in this chart our price is reach two time in similar place than we draw a circle on that price than wait for any movement and than after some time you can see our price is moving in lower side with red candle and than also you drawn a lower trendline than our price is breakdown this lower trendline with big red candle and than we execute our trade. Than our target hit this way we can trade on this pattern.
Conclusion :-
The conclusion of this post is that first we have some candle sticks pattern than learn some pattern and than come in stockmarket than start trading and than also we need patience than we become a good trade and also this is time taking process this is not for only some days and some months time is a long time taken process. This is the conclusion of this post.



Nice Post Of Chart Pattern