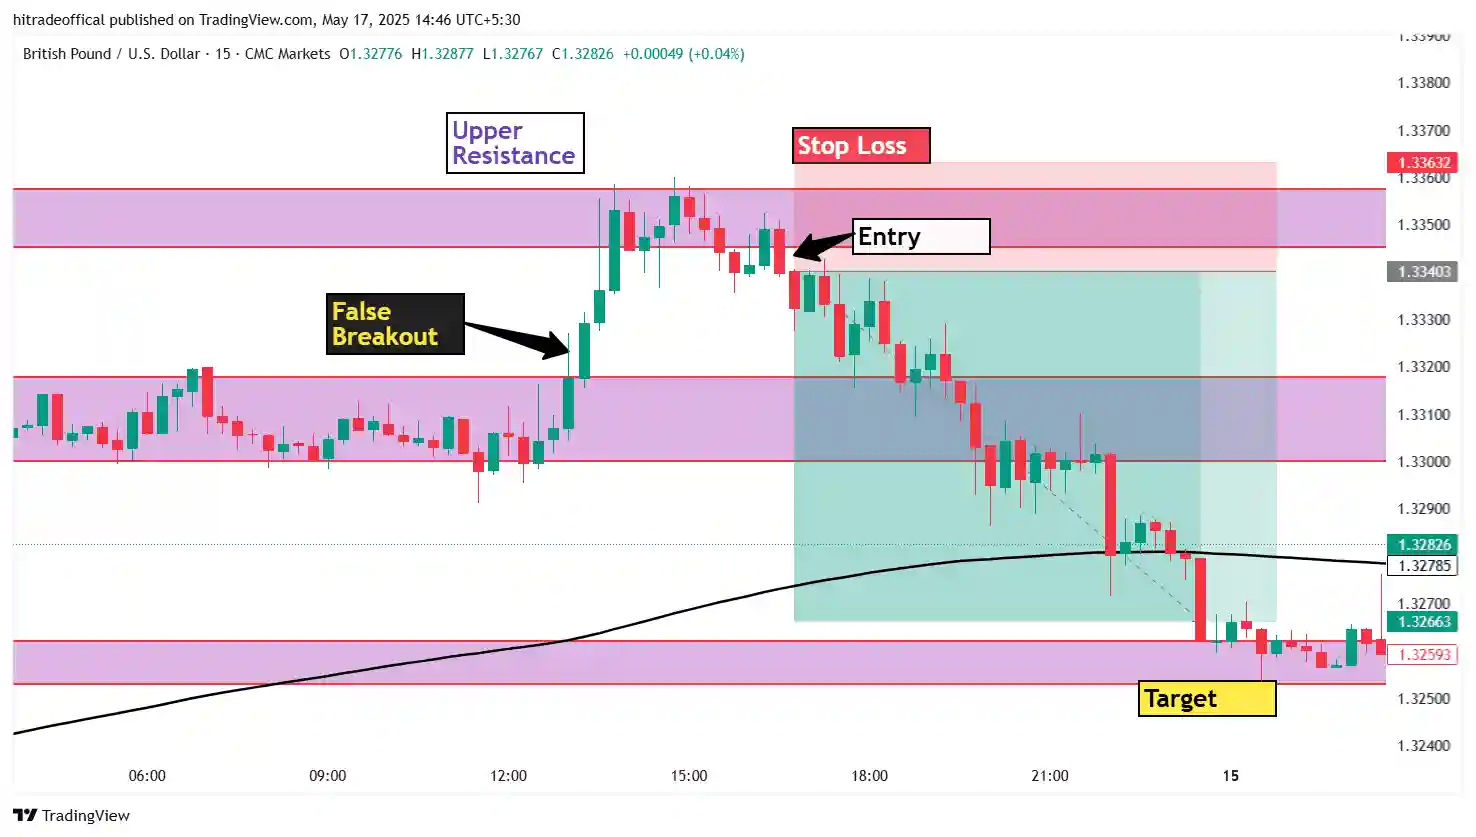
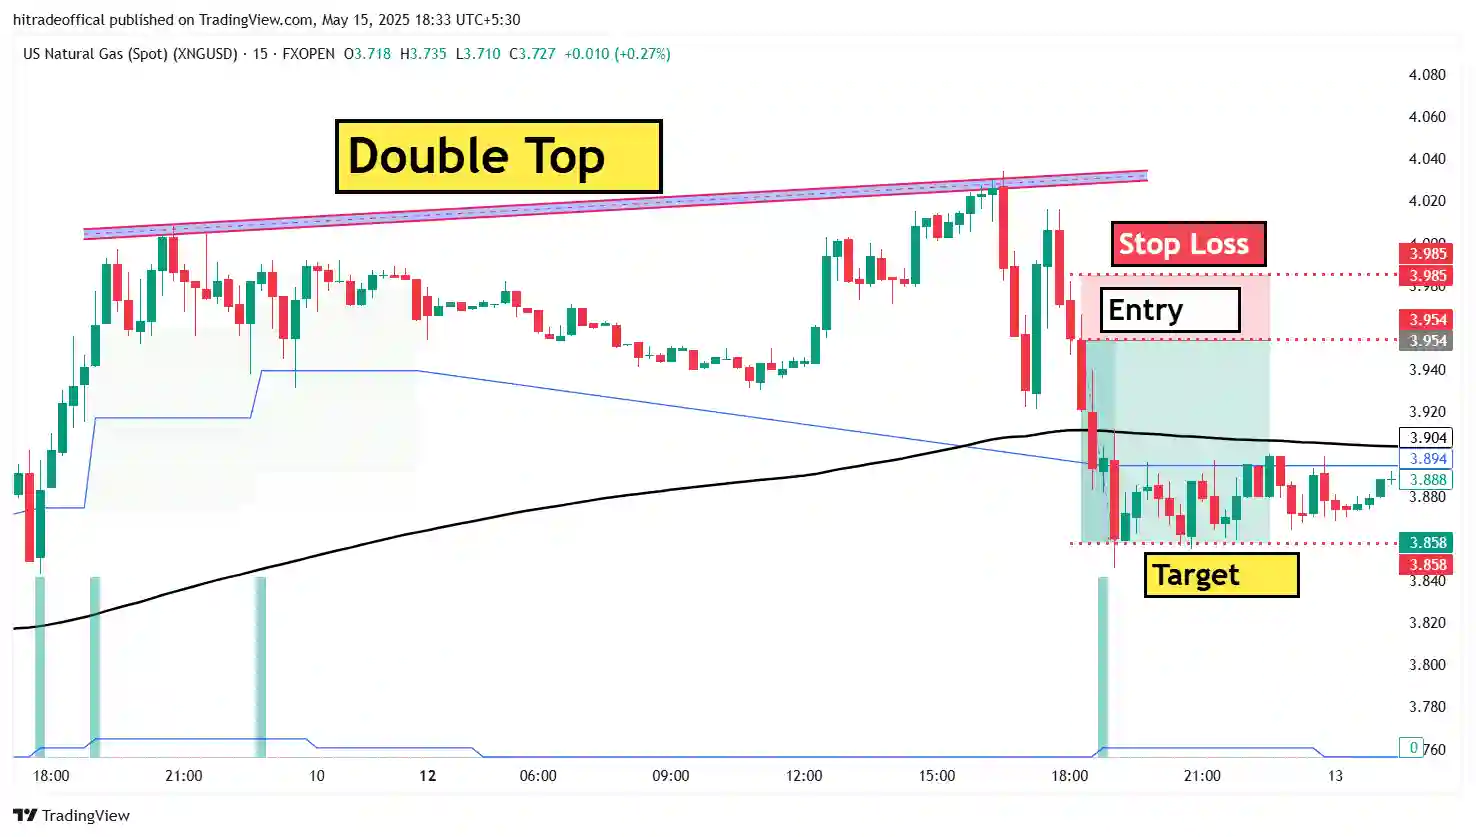
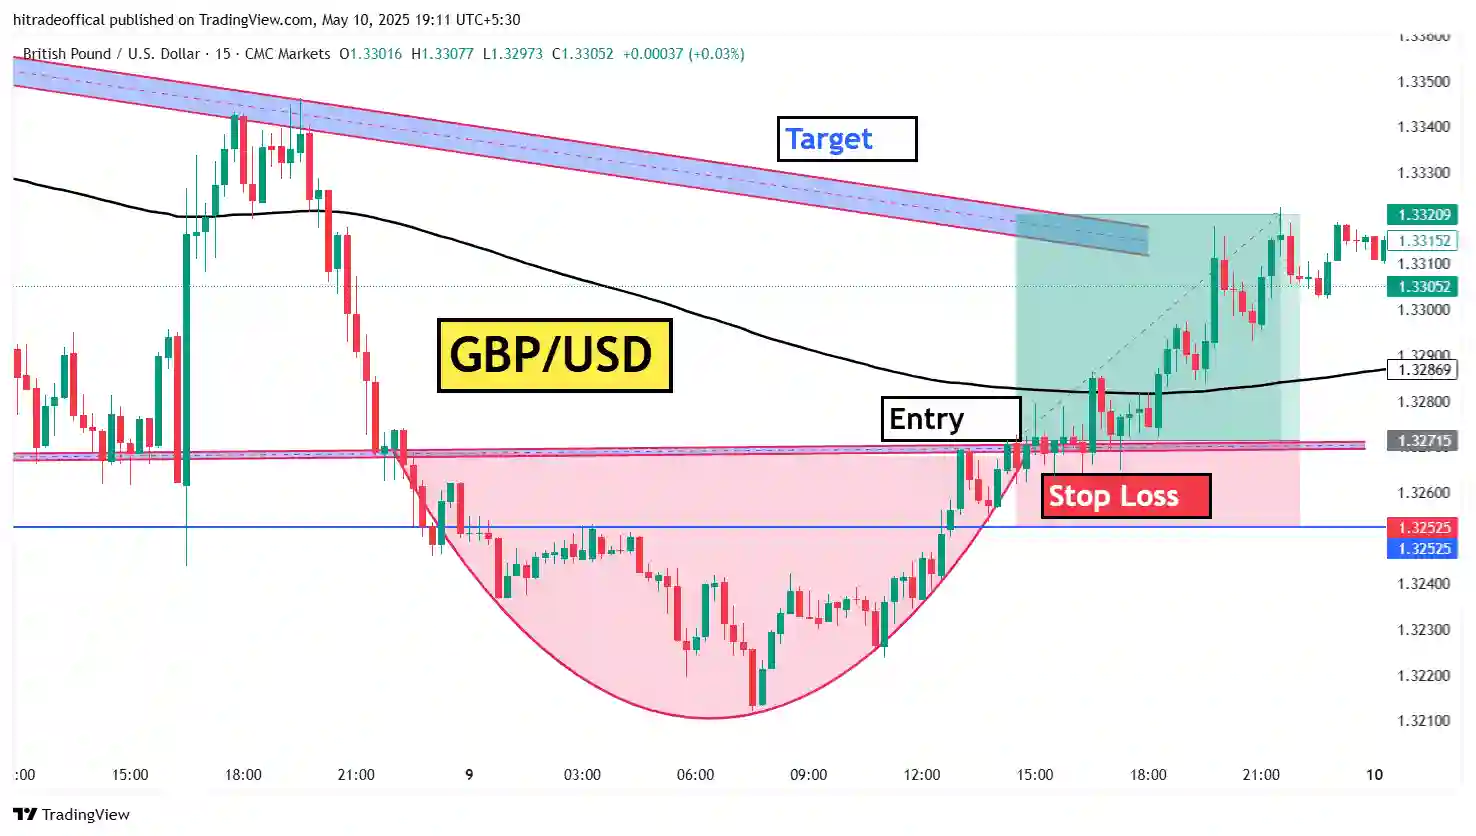
About this image :-
You can see today we talk about some price action in using us oil trading. So learn carefully if you have any question for me than you can email me otherwise you can also follow my YouTube Channel. Welcome to this post please learn carefully for you trading life. @hitradeofficial.
Which price action use in this chart :-
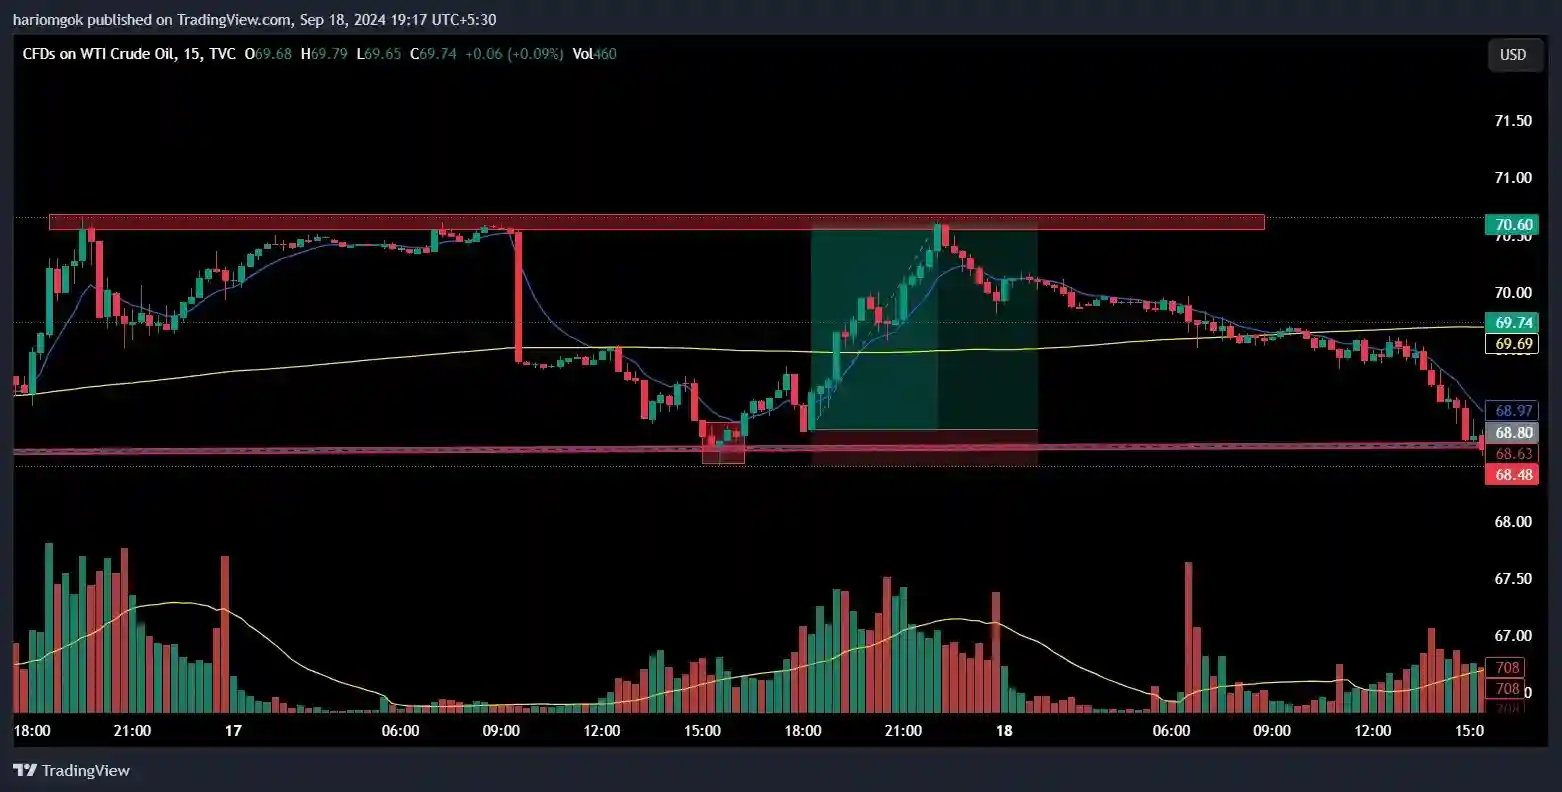
In this chart use only price action and the price action you can see and identify which one is use in this chart if you are not able to identify this price action than first to first you learn price action and now start your learning in this chart price action use morning star and when morning star price is form in support than we focus carefully and than when price started retesting than we can buy and our stop loss is also very low and than after some candle our target is also hit. This is the price action use in this chart and in this trading day.
How to learn price action from starting :-
Do you want to learn price action than you first start learning chart than also in online lot of books and lot of pdf and google is also available you can learn there and you daily minimum you see 2 hours. chart daily than you can learn price action and also you need to learn chart pattern than you can follow me because I daily post about chart pattern post also price action and now start you trading with only some types of price action. This way you can learn price action from starting.
What is the process of chart analysis :-
The process is chart analysis is first to first you open any chat than you start find any support and resistance and you try to start from longer time frame than its good for trading and first you see 12 months candle and see what happen in last year and than you shift 1 Day candle and draw support and resistance and if you want to analysis for intraday trading than you have to analysis also 15 min time frame and than 5 min but don’t trade in shorter time frame like 5 min, 3 min, 2 min, and 1 min, because there lot of trap form and in these trap may be you confused and than you make loss you avoid this and than wait for any movement and than any movement is form and also don’t trade in first movement or first breakout and than any price action or chart pattern of candle sticks are form than you can trade. This is the process of chart analysis.
Learning of this post :-
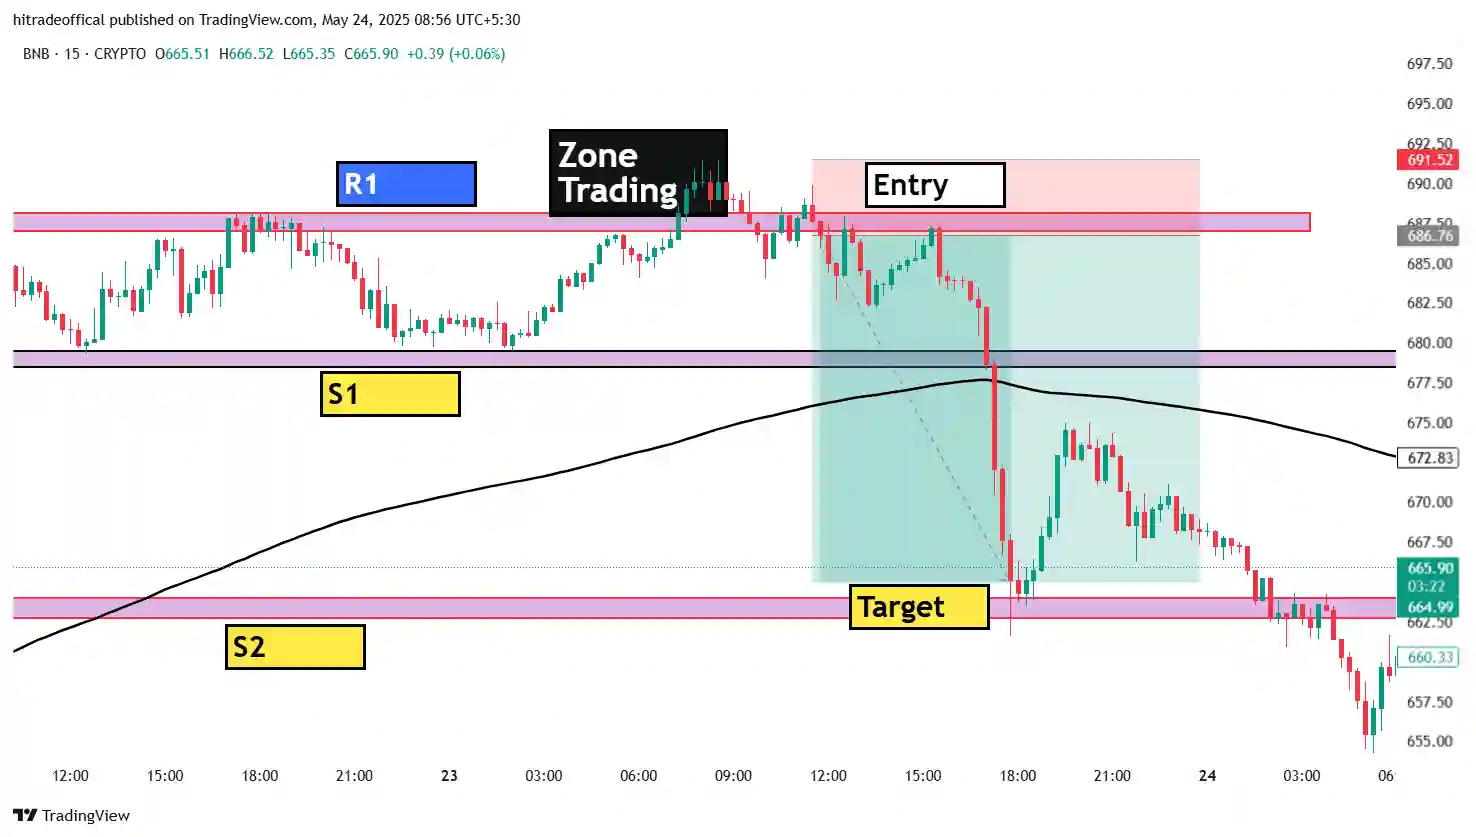
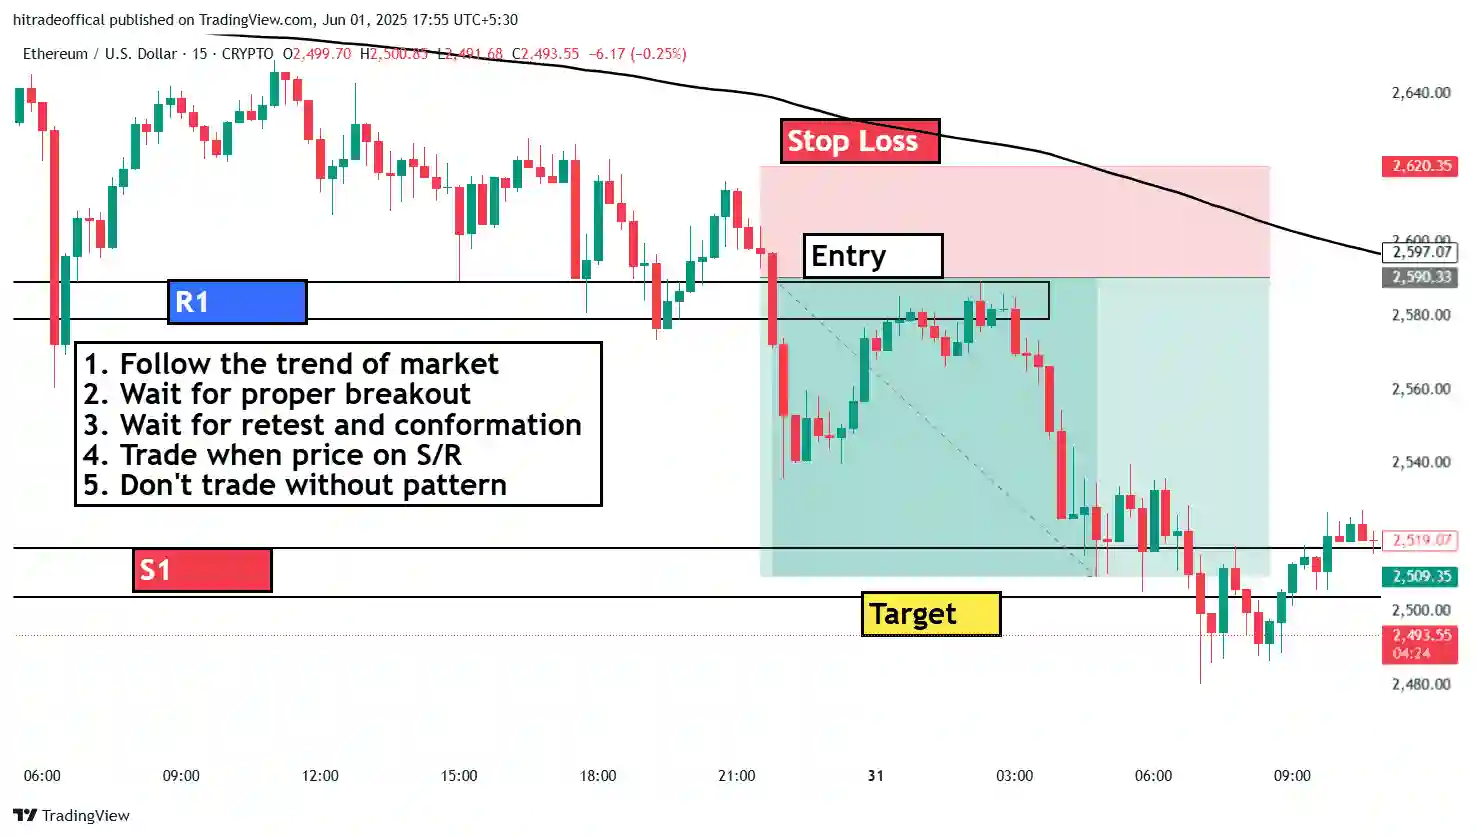
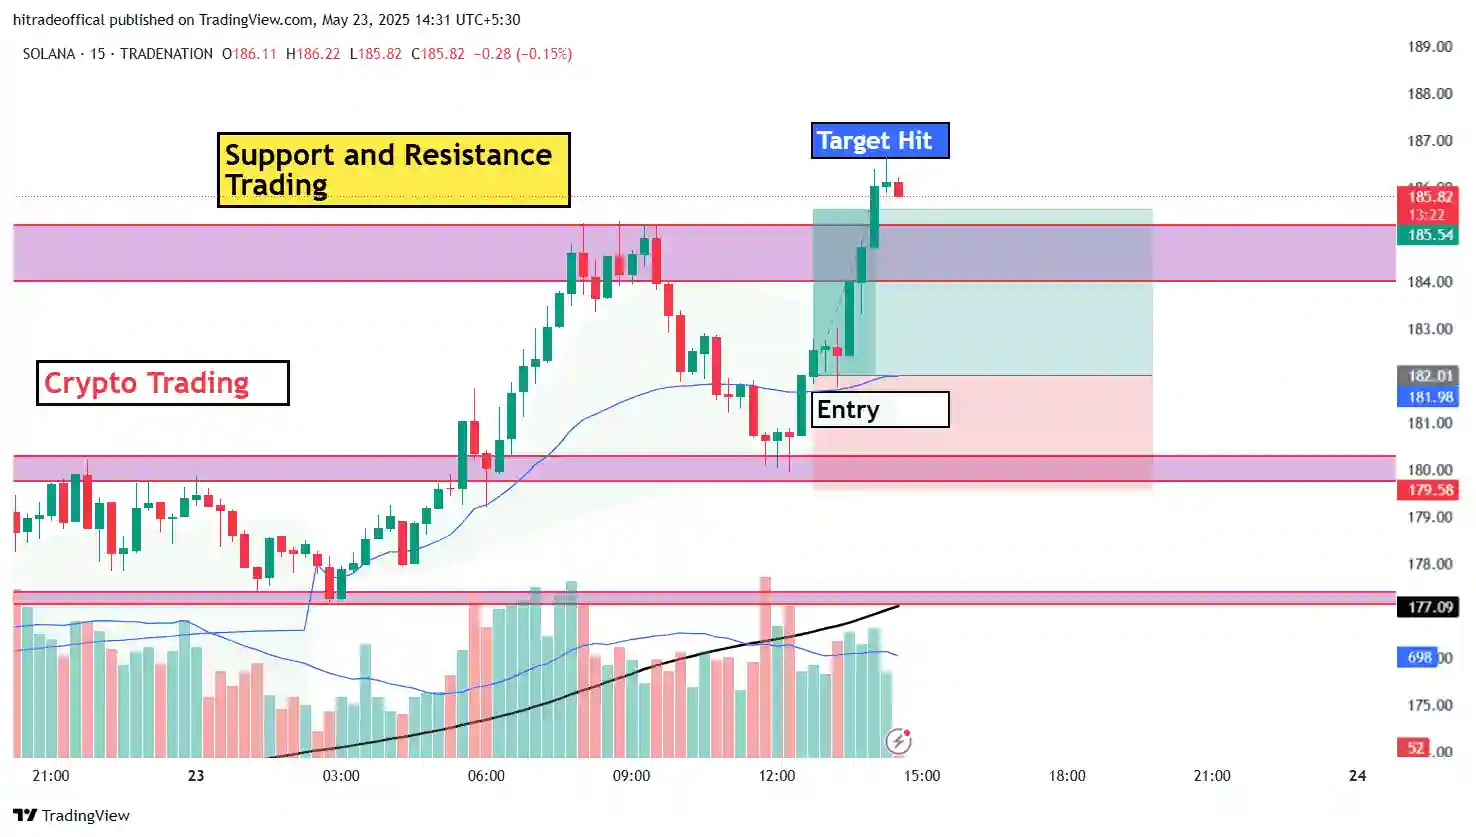
The learning of this post is that first to first you try to avoid in trade shorter time frame and than make support and resistance in longer time frame and than without price action don’t trade and also without any candle sticks don’t trade and than don’t trade in first breakout. These are some learning of this post.
