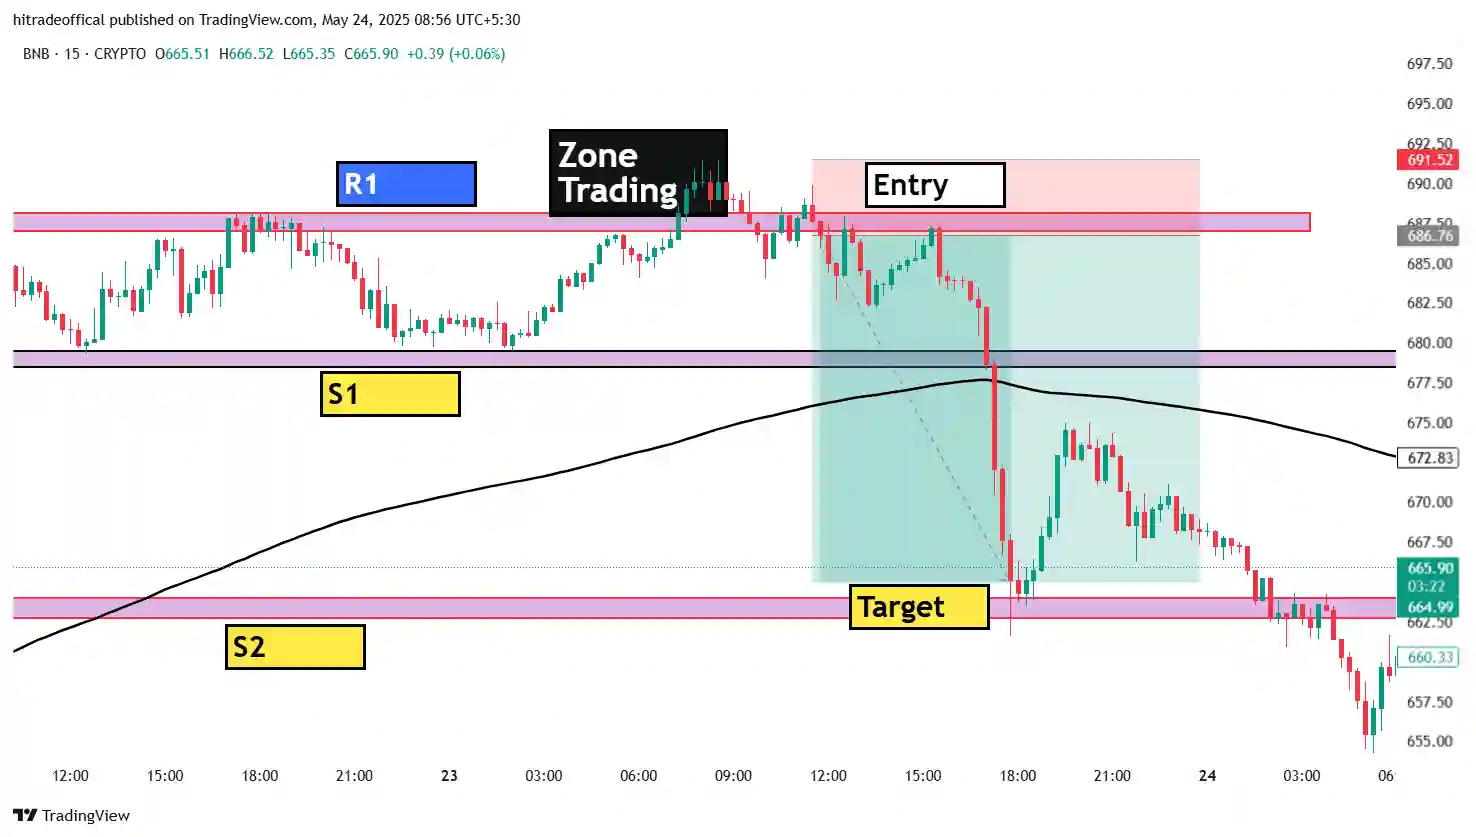
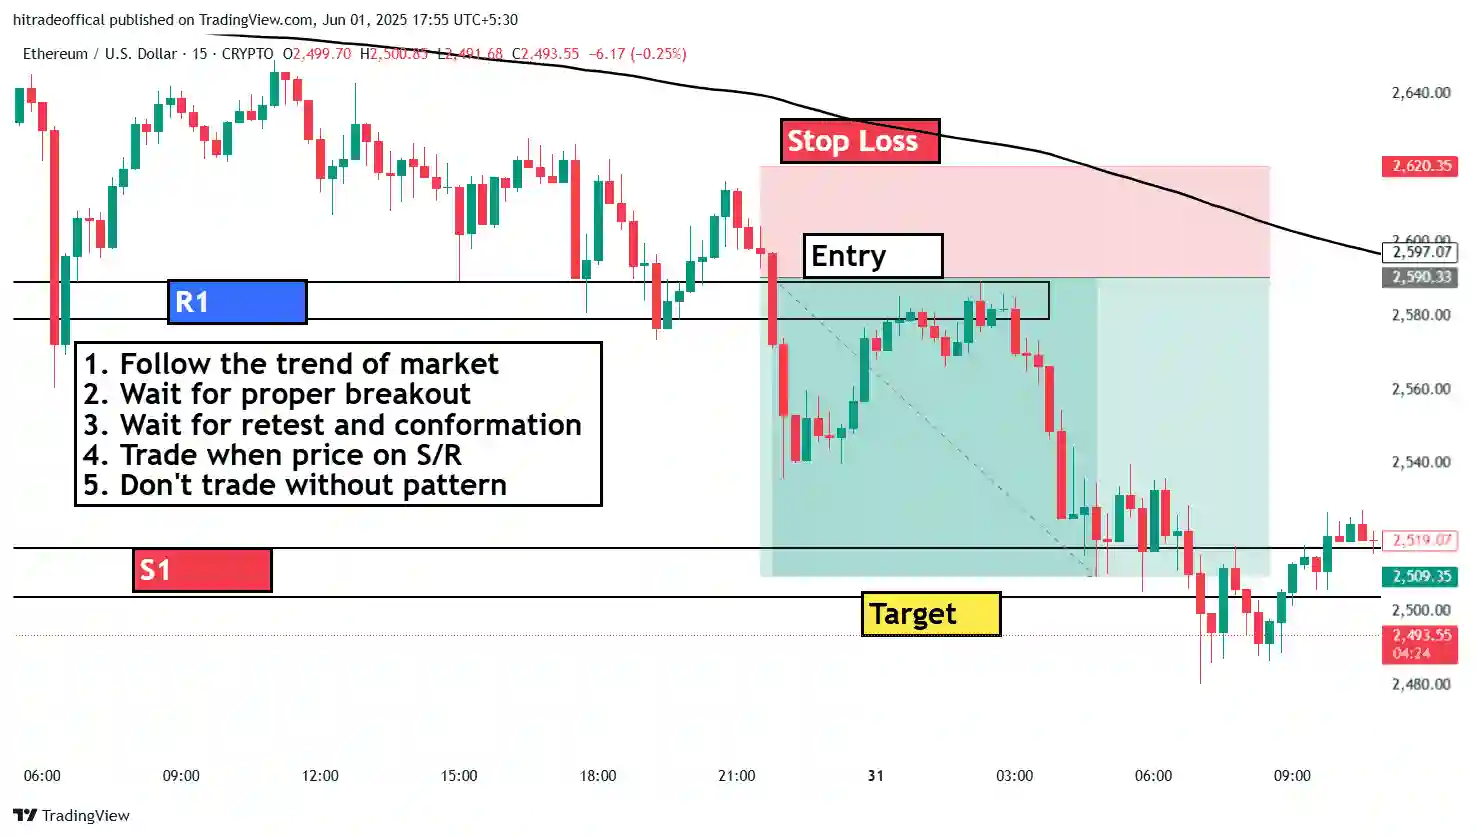
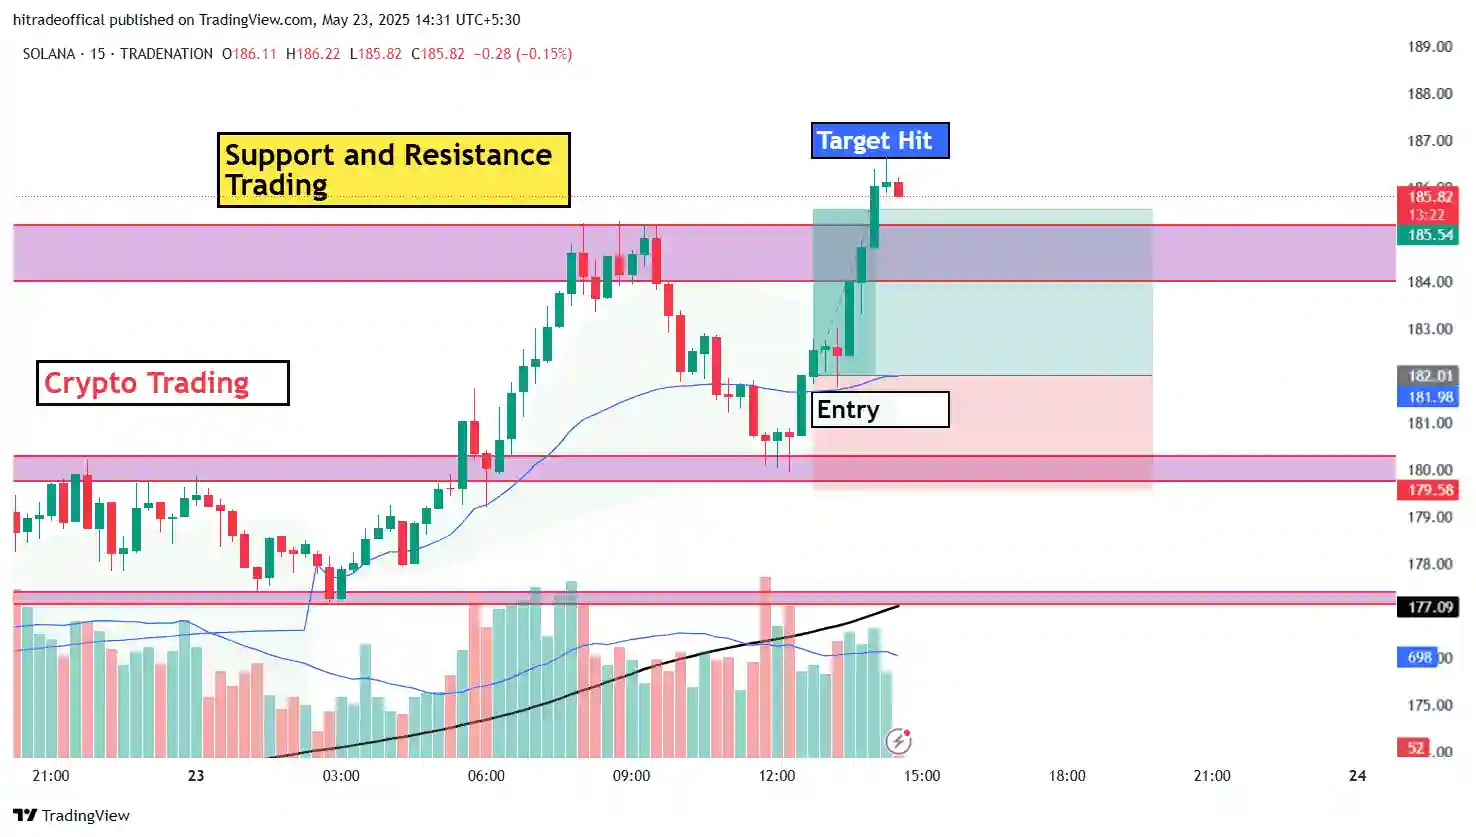
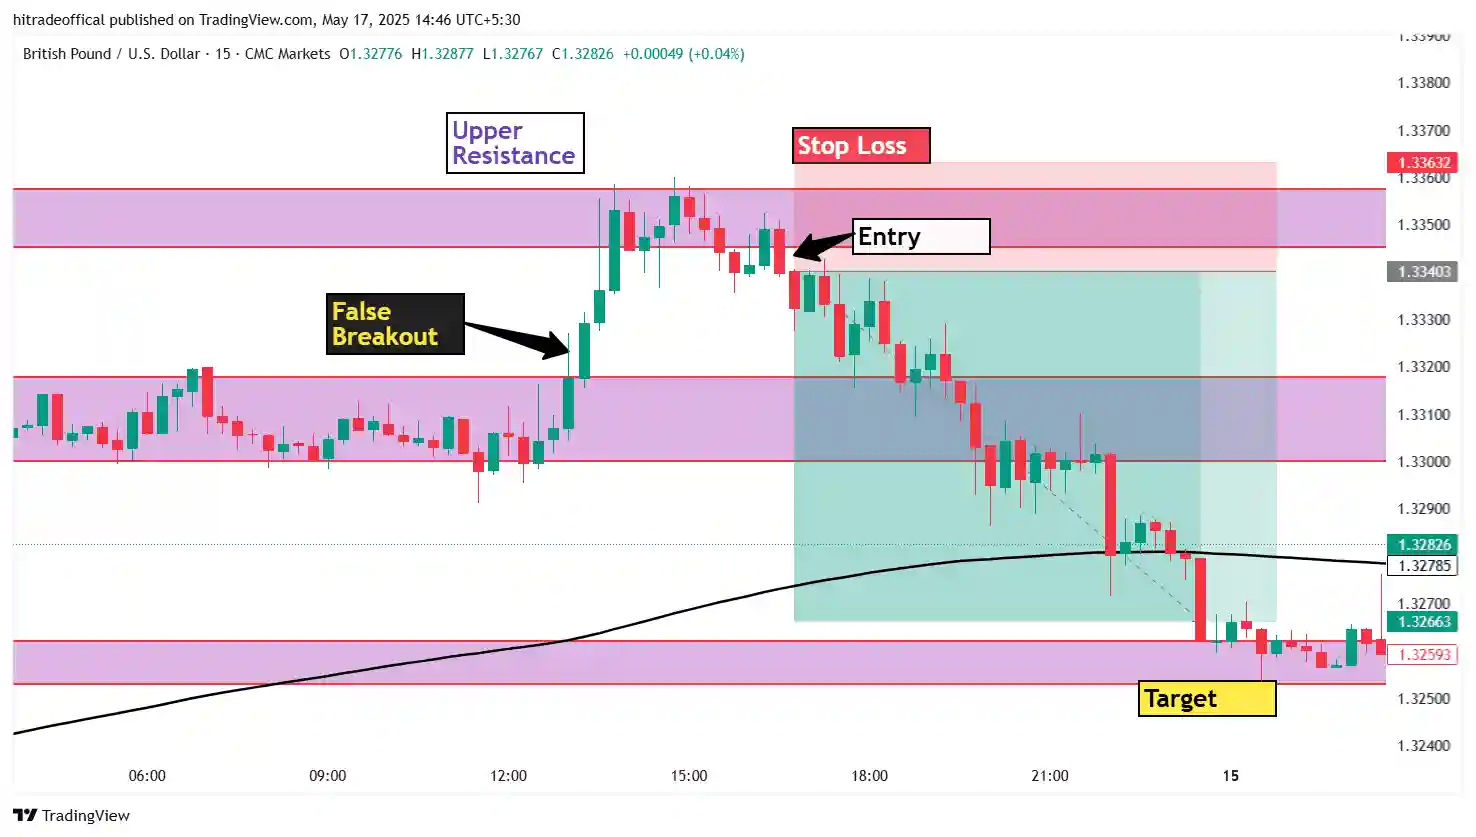
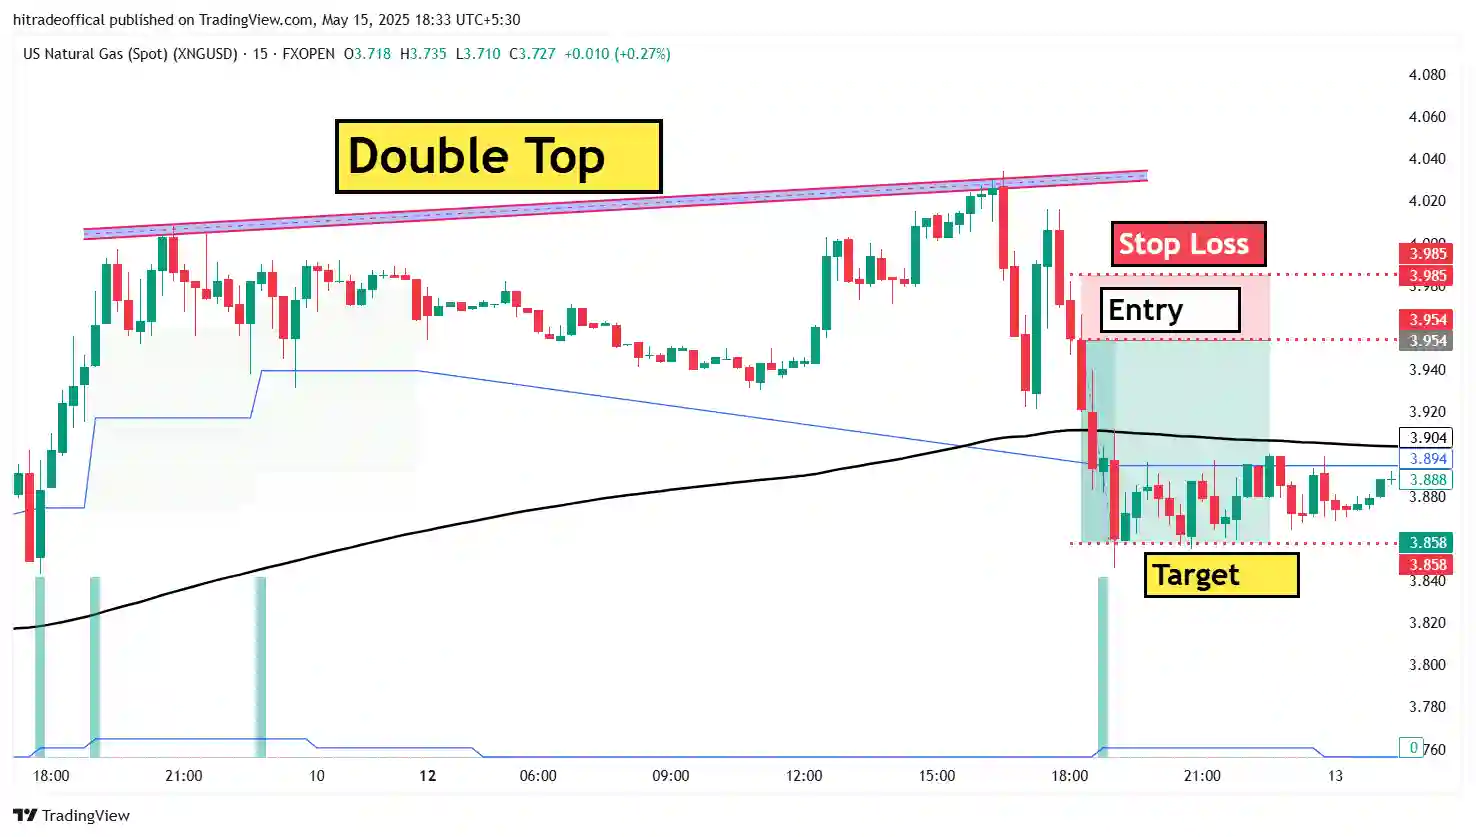
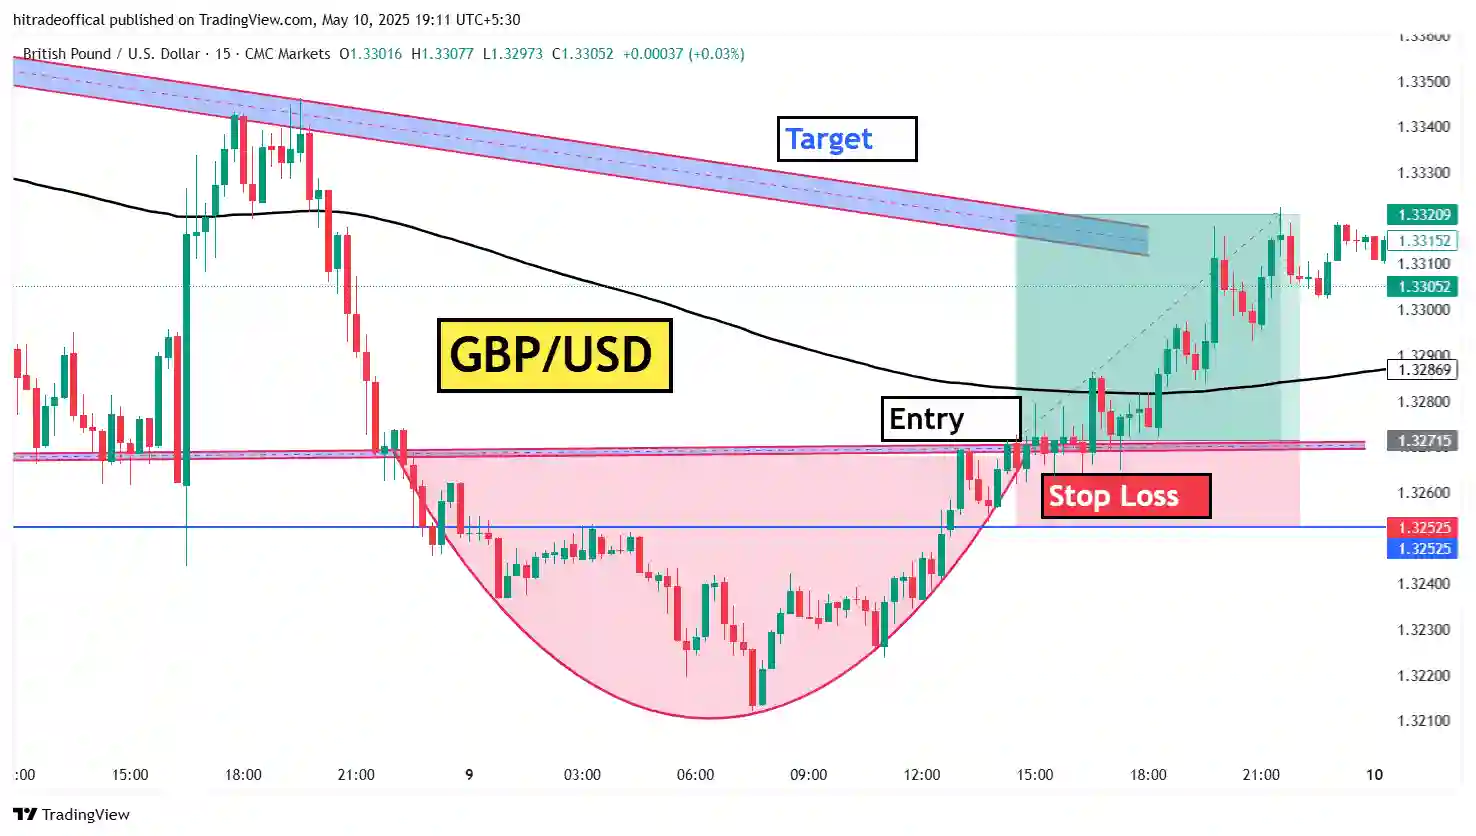
About This Image Details :-
In this image a pattern form this pattern name is Ascending Triangle Pattern and then a good breakout in upper side after than our target hit and this chart of U.S Oil .
How To Form This Pattern :-
Fist price move in upper side and then lower side again same process follow three times upper side move in constant place This place know as resistance. And similar to lower side move constant place and place know as support. And suddenly breakout in upper side. This way form this chart pattern.
How To Identify This Pattern :-
When price move in a triangle form and more than 2 time move price in upper side as well as lower side then we can say that ascending triangle pattern. In this pattern we have to see only form a good triangle and then we can say that this is ascending triangle pattern. This way we can say identify this pattern.
How To Trade In This Pattern :-
First to first we need to identify this pattern when we identify this pattern than we have to focus on this chart when breakout in form with using some trap then we can trade otherwise if trap is not form then wait for more than two candle then two candle is form if candle color is green than we can trade in buy side. This way we can trade in this pattern.
How To Identify Trap In Any Pattern :-
If any pattern is form then we want to trade in any pattern then when our trade is execute then suddenly our stop loss is hit due to our patience of first we need to patience then we have to remove trade on false breakout like that if any breakout is form then we have to measure our stoploss then if stoploss is our range then we can trade if stoploss is not our range then skip this trade. This is a way we can identify trap in any pattern also skip our losses.


