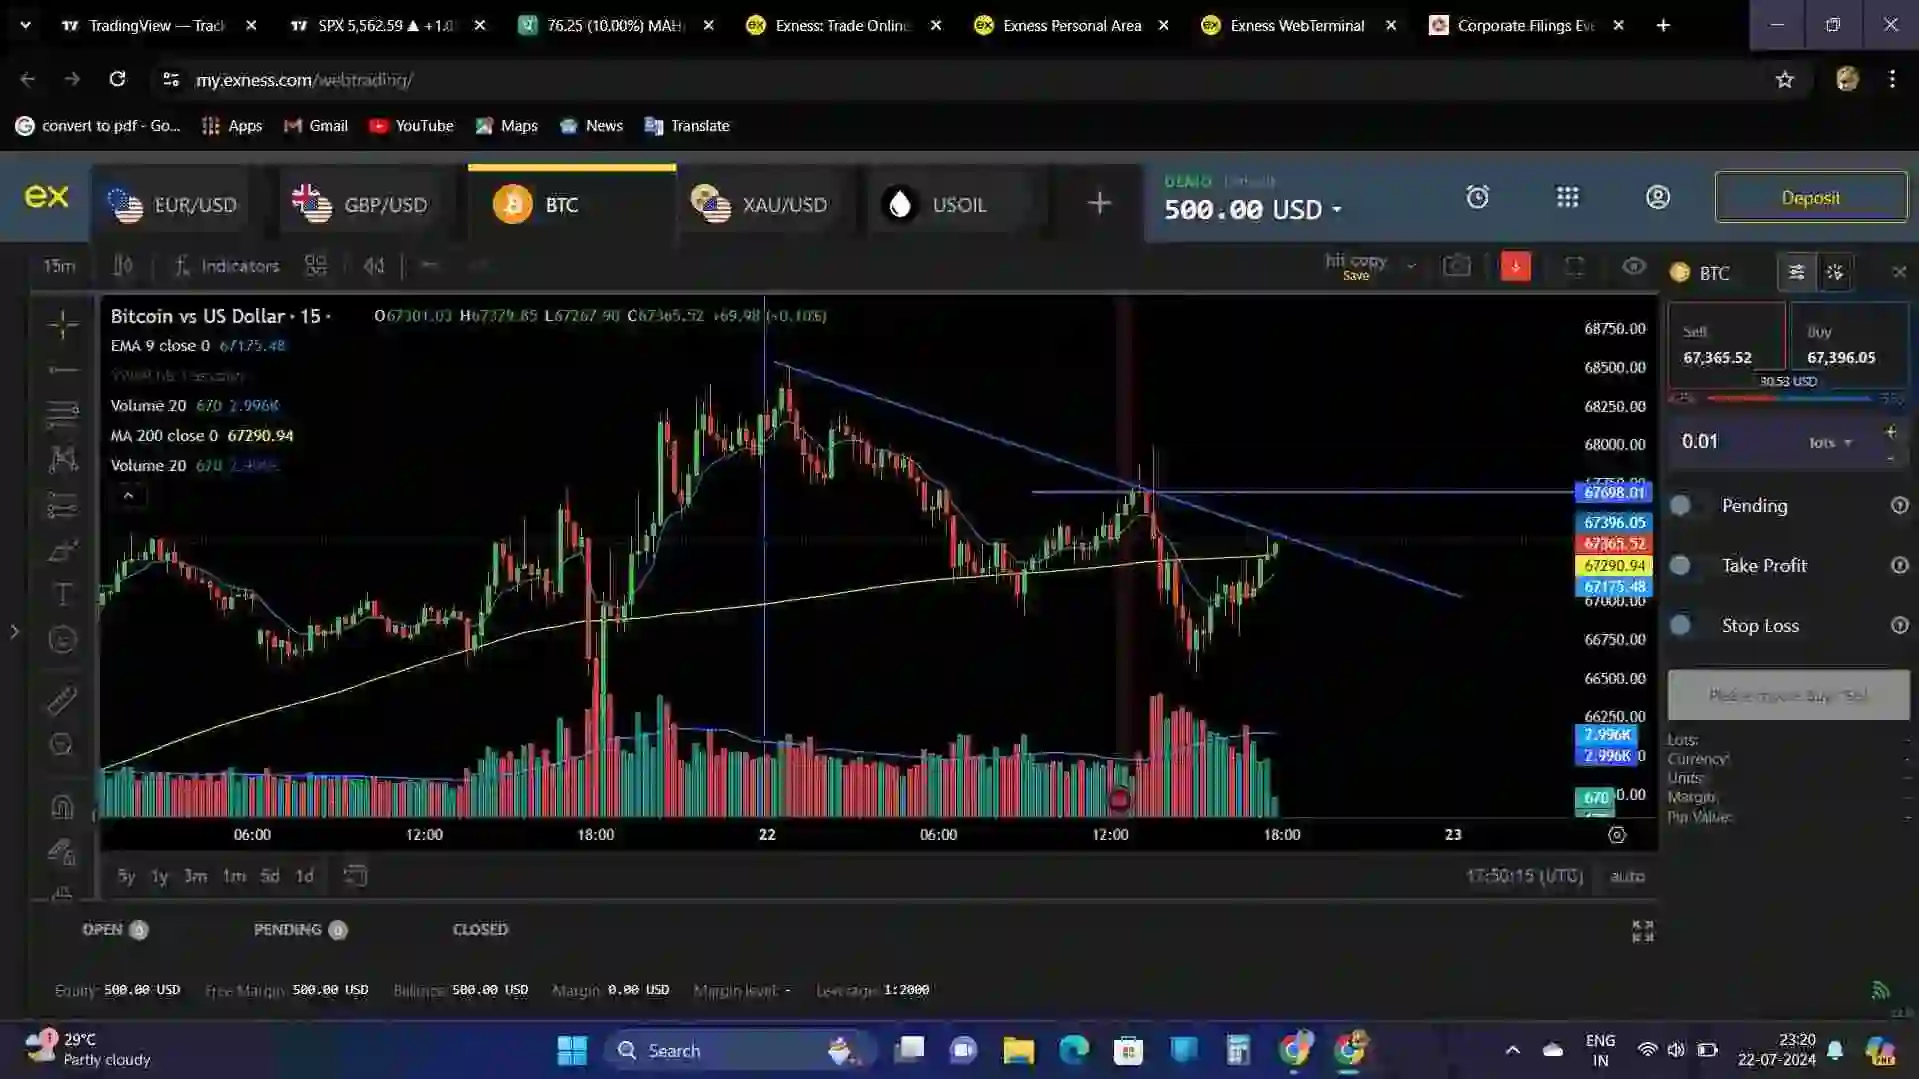
This is the Chart Pattern Of Bitcoin :-
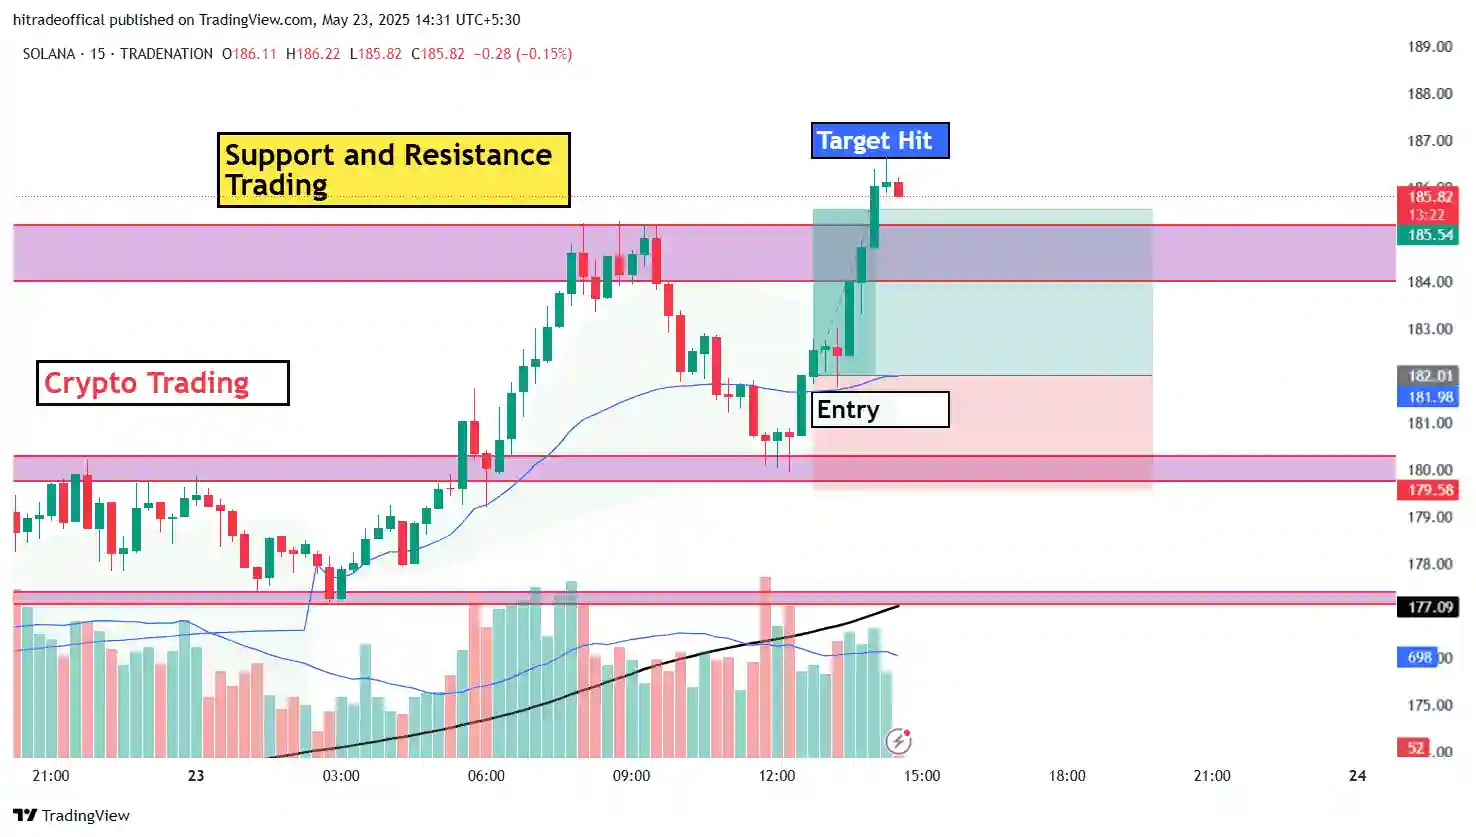
Case no.1 :- When Breakout is real breakout like that :- when breakout with big green candle and market support this price and some time follow the trend then it may be it is a real breakout and in this case may be price will be suddenly increase and this is called a bullish breakout then we have to plain our trade in buy side this is our first case in this btc chart.
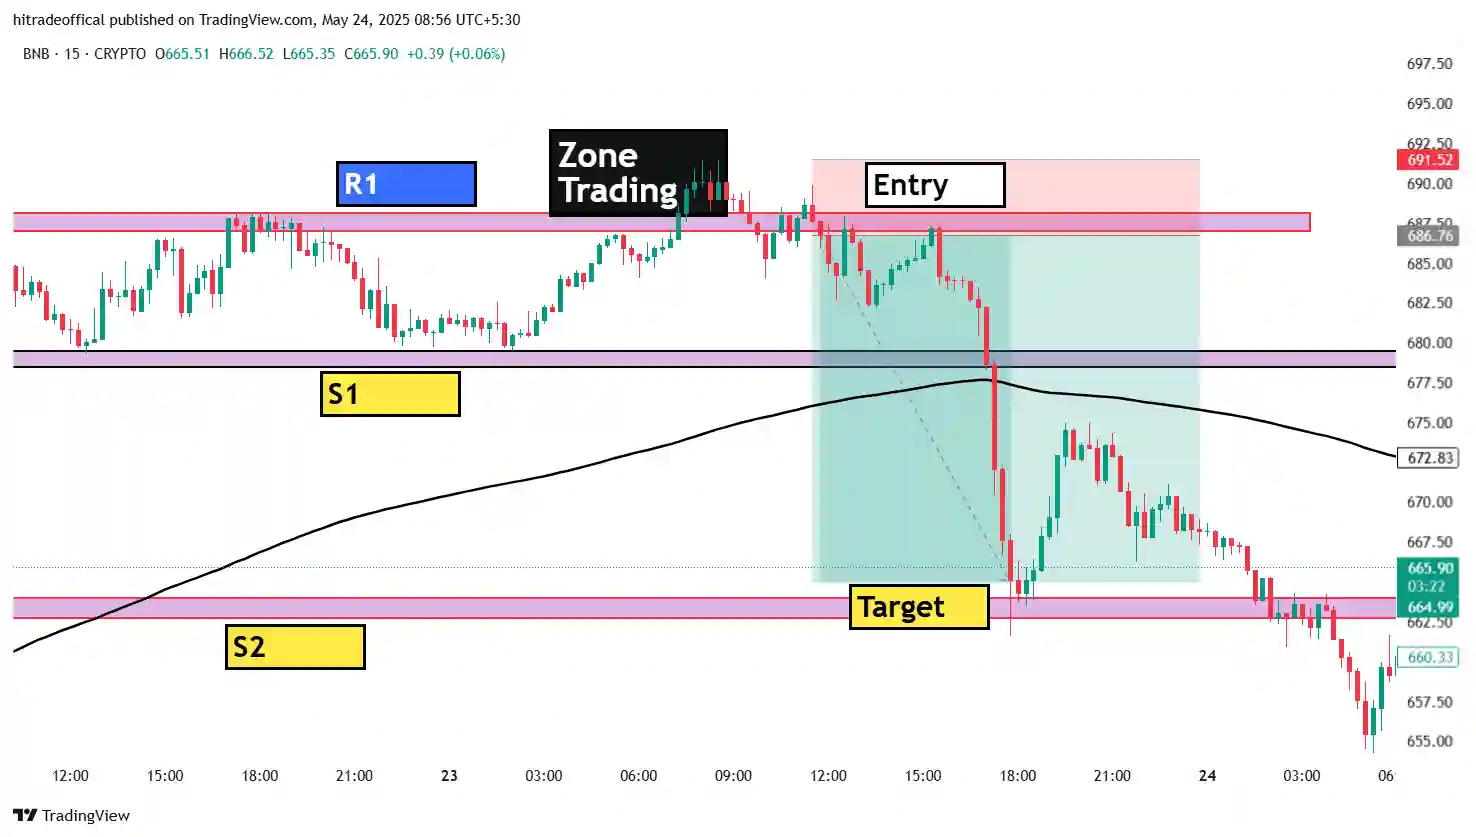
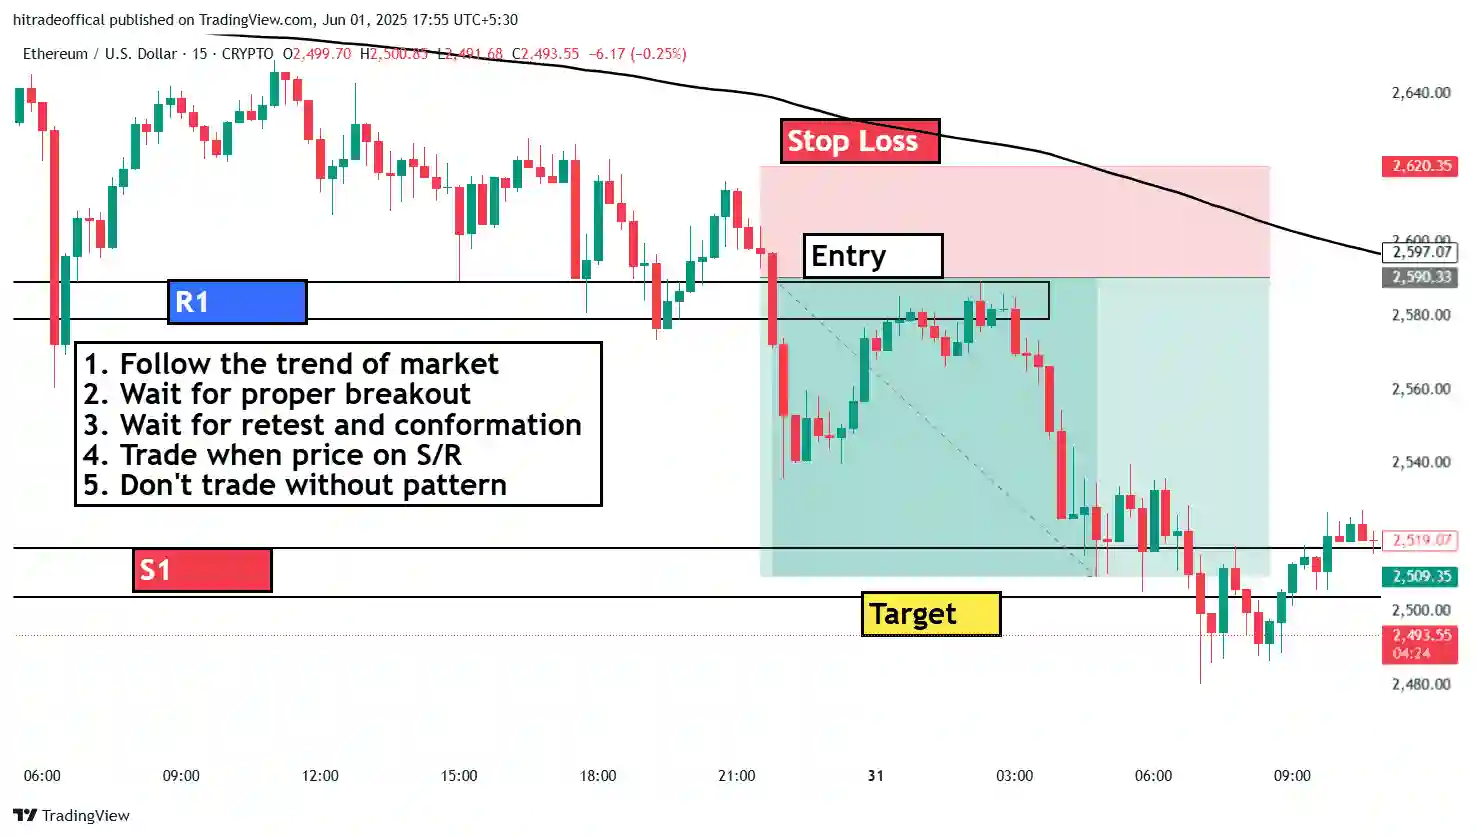
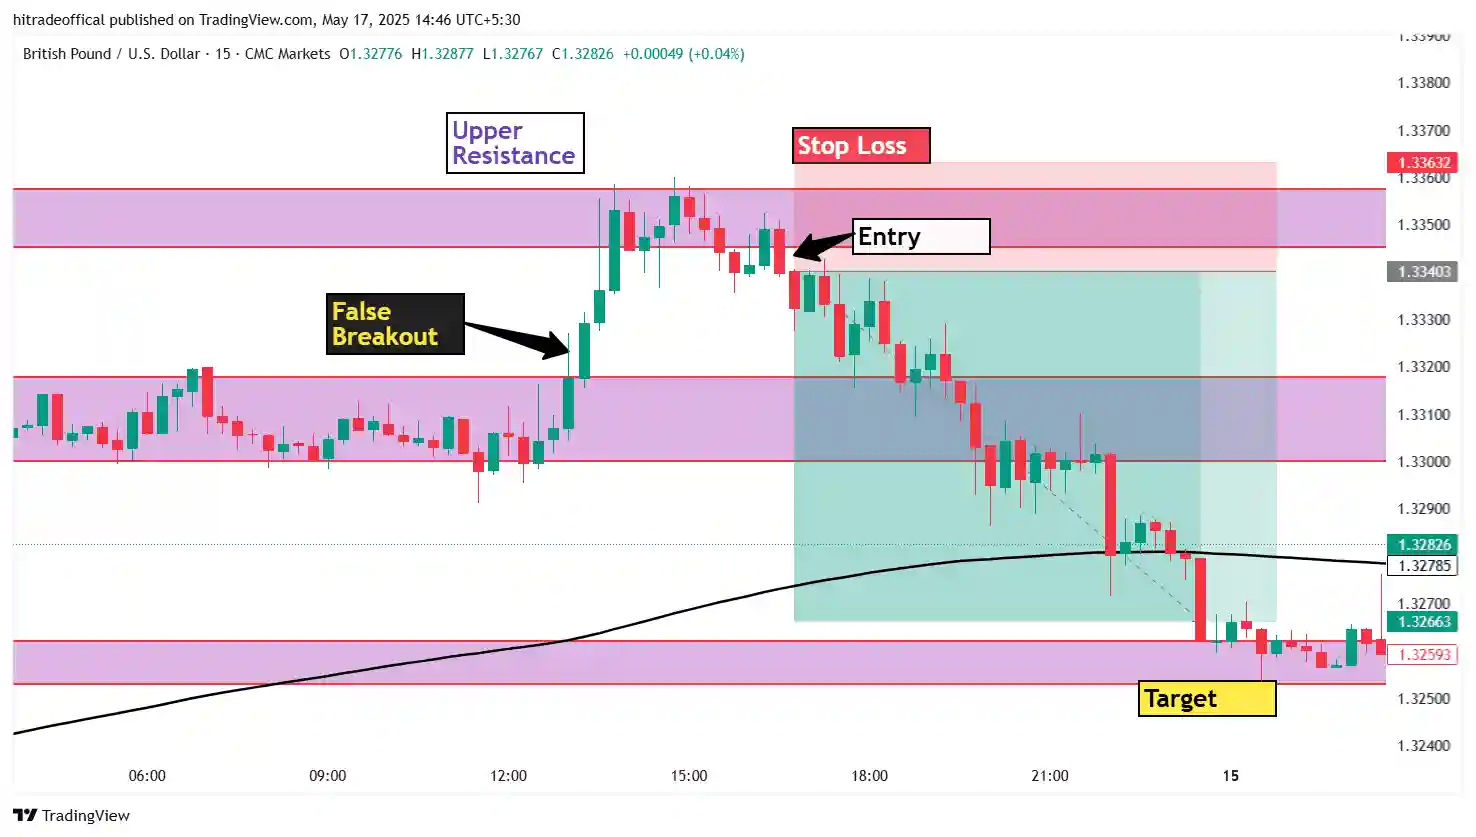
Case no.2 :- When Breakout is fake breakout like that :- when breakout with normal green candle and red candle and other types of candle but it price doesn’t support the market then may be price will be decreases this is called a fake breakout in this case we have to plain our trade in sell side this our second case in this btc chart.
Conclusion :- Finally, we have to know conclusions in this bitcoin chart as you know that in this chart two opportunities the first one opportunity is take trade in buy side but in case no.1 is properly read then if obey this rule then we can trade in buy side and the our second opportunity is take trade in sell side in this way first to first read case no.2 then if obey this rule then can trade in sell side these are two opportunities with the help us we can easily identify trade direction.
Note:- This post is only for educational purpose we do not force to take any type of decision.
